Xerox 2014 Annual Report Download - page 51
Download and view the complete annual report
Please find page 51 of the 2014 Xerox annual report below. You can navigate through the pages in the report by either clicking on the pages listed below, or by using the keyword search tool below to find specific information within the annual report.-
 1
1 -
2
-
3
-
4
-
5
-
6
-
7
-
8
-
9
-
10
-
11
-
12
-
13
-
14
-
15
-
16
-
17
-
18
-
19
-
20
-
21
-
22
-
23
-
24
-
25
-
26
-
27
-
28
-
29
-
30
-
31
-
32
-
33
-
34
-
35
-
36
-
37
-
38
-
39
-
40
-
 41
41 -
 42
42 -
 43
43 -
 44
44 -
 45
45 -
 46
46 -
 47
47 -
 48
48 -
 49
49 -
 50
50 -
 51
51 -
 52
52 -
 53
53 -
 54
54 -
 55
55 -
 56
56 -
 57
57 -
 58
58 -
 59
59 -
 60
60 -
 61
61 -
62
-
63
-
64
-
65
-
66
-
67
-
68
-
69
-
70
-
71
-
72
-
73
-
74
-
75
-
76
-
77
-
78
-
79
-
80
-
81
-
82
-
83
-
84
-
85
-
86
-
87
-
88
-
89
-
90
-
91
-
92
-
93
-
94
-
95
-
96
-
97
-
98
-
99
-
100
-
101
-
102
-
103
-
104
-
105
-
106
-
107
-
108
-
109
-
110
-
111
-
112
-
113
-
114
-
115
-
116
-
117
-
118
-
119
-
120
-
121
-
122
-
123
-
124
-
125
-
126
-
127
-
128
-
129
-
130
-
131
-
132
-
133
-
134
-
135
-
136
-
137
-
138
-
139
-
140
-
141
-
142
-
143
-
144
-
145
-
146
-
147
-
148
-
149
-
150
-
151
-
152
 |
 |

The operating margin1for the year ended December 31, 2013 of 9.0% decreased 0.7-percentage points as
compared to 2012. The decline was driven primarily by a decline in gross margin of 0.8-percentage points partially
offset by a moderate improvement in operating expenses as a percent of revenue. The operating margin decline
reflects continued pressure on Services margins from higher healthcare platform expenses and the run-off of the
student loan business, as well as from higher pension settlement costs impacting Document Technology.
_____________
(1) See the "Non-GAAP Financial Measures" section for an explanation of the Operating Margin non-GAAP financial measure.
Gross Margins
Total Gross Margin
Total gross margin for year ended December 31, 2014 of 32.0% decreased 0.4-percentage points as compared to
2013. The decrease was driven by margin declines within the Services segment as well as the impact of a higher
proportion of our revenue from Services (which historically has a lower gross margin than Document Technology)
partially offset by a higher gross margin within the Document Technology segment.
Gross margin for year ended December 31, 2013 of 32.4% decreased 0.8-percentage points as compared to 2012.
The decrease was driven by margin declines within the Services segment as well as the continued increase in
services revenue as a percent of total revenue.
Services Gross Margin
Services gross margin for the year ended December 31, 2014 decreased 1.1-percentage points as compared to
2013. The decrease is primarily due to higher expenses associated with our public sector and government
healthcare businesses, including costs for the Medicaid and Health Insurance Exchange (HIX) platforms, the
anticipated run-off of our student loan business and price declines that were consistent with prior periods. These
impacts were only partially offset by productivity improvements and restructuring benefits.
Services gross margin for the year ended December 31, 2013 decreased 0.7-percentage points as compared to
2012. The decrease is primarily due to revenue mix in the segment, the run-off of our student loan business, lower
volumes in some areas of the business and higher healthcare platform costs. These impacts were only partially
offset by productivity improvements and restructuring benefits.
Document Technology Gross Margin
Document Technology gross margin for the year ended December 31, 2014 increased by 1.5-percentage points as
compared to 2013. The increase, driven by cost productivity and restructuring savings, favorable transaction
currency on our Yen-based purchases, lower pension expense and favorable revenue mix, was partially offset by
moderate price declines and the impact of the prior year finance receivable gain.
Document Technology gross margin for the year ended December 31, 2013 increased by 0.1-percentage points as
compared to 2012. The increase was driven by cost productivities and favorable transaction currency on our Yen-
based purchases, which more than offset the impact of price declines and mix.
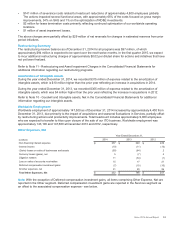
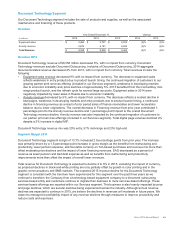
Research, Development and Engineering Expenses (RD&E)
Year Ended December 31, Change
(in millions) 2014 2013 2012 2014 2013
R&D $445$481 $545 $(36)$ (64)
Sustaining engineering 132 122 110 10 12
Total RD&E Expenses $577$603 $655 $(26)$ (52)
R&D Investment by Fuji Xerox(1) $ 654 $ 724 $860 $(70)$ (136)
______________
(1) Fluctuation in Fuji Xerox R&D was primarily due to changes in foreign exchange rates.
RD&E as a percent of revenue for the year ended December 31, 2014 of 3.0% remained flat, reflecting the impact
of restructuring and productivity improvements and a higher mix of Services revenue (which historically has a lower
RD&E as a percentage of revenue), offset by increased investments in Services RD&E and the overall total
company revenue decline.
RD&E of $577 million for the year ended December 31, 2014, was $26 million lower than 2013 reflecting the impact
of restructuring and productivity improvements.
Xerox 2014 Annual Report 36