Xerox 2014 Annual Report Download - page 57
Download and view the complete annual report
Please find page 57 of the 2014 Xerox annual report below. You can navigate through the pages in the report by either clicking on the pages listed below, or by using the keyword search tool below to find specific information within the annual report.-
 1
1 -
2
-
3
-
4
-
5
-
6
-
7
-
8
-
9
-
10
-
11
-
12
-
13
-
14
-
15
-
16
-
17
-
18
-
19
-
20
-
21
-
22
-
23
-
24
-
25
-
26
-
27
-
28
-
29
-
30
-
31
-
32
-
33
-
34
-
35
-
36
-
37
-
38
-
39
-
40
-
41
-
42
-
43
-
44
-
45
-
46
-
 47
47 -
 48
48 -
 49
49 -
 50
50 -
 51
51 -
 52
52 -
 53
53 -
 54
54 -
 55
55 -
 56
56 -
 57
57 -
 58
58 -
 59
59 -
 60
60 -
 61
61 -
 62
62 -
 63
63 -
 64
64 -
 65
65 -
 66
66 -
 67
67 -
68
-
69
-
70
-
71
-
72
-
73
-
74
-
75
-
76
-
77
-
78
-
79
-
80
-
81
-
82
-
83
-
84
-
85
-
86
-
87
-
88
-
89
-
90
-
91
-
92
-
93
-
94
-
95
-
96
-
97
-
98
-
99
-
100
-
101
-
102
-
103
-
104
-
105
-
106
-
107
-
108
-
109
-
110
-
111
-
112
-
113
-
114
-
115
-
116
-
117
-
118
-
119
-
120
-
121
-
122
-
123
-
124
-
125
-
126
-
127
-
128
-
129
-
130
-
131
-
132
-
133
-
134
-
135
-
136
-
137
-
138
-
139
-
140
-
141
-
142
-
143
-
144
-
145
-
146
-
147
-
148
-
149
-
150
-
151
-
152
 |
 |

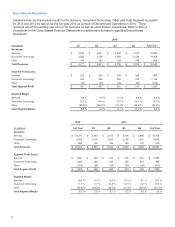
Note: The above table has been revised to reflect the reclassification of the ITO business to Discontinued
Operations. Segment profit associated with the ITO business reclassified from the Services segment to
Discontinued Operations was $107 million, $100 million and $82 million for 2014, 2013 and 2012, respectively.
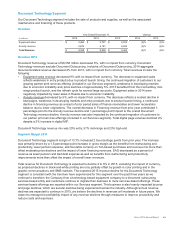
Services Segment
Our Services segment is comprised of two service offerings: Business Process Outsourcing (BPO) and Document
Outsourcing (DO).
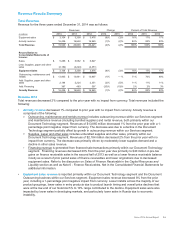
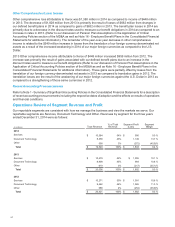
Services segment revenues for the three years ended December 31, 2014 were as follows:
Revenue Change
(in millions) 2014 2013 2012 2014 2013
Business processing outsourcing $ 7,304 $7,244 $7,162 1% 1%
Document outsourcing 3,388 3,337 3,210 2% 4%
Less: Intra-segment elimination (108)(102)(101)6%1%
Total Services Revenue $10,584 $10,479 $10,271 1% 2%
__________
Note: The above table has been revised to reflect the reclassification of the ITO business to Discontinued
Operations. Additionally, 2013 and 2012 BPO revenues have been revised to conform to the 2014 presentation of
revenues.
Revenue 2014
Services revenue of $10,584 million increased 1% with no impact from currency.
•BPO revenue increased 1% and represented 68% of total Services revenue. Growth from acquisitions along
with organic growth in commercial healthcare and litigation services as well as growth internationally were
partially offset by declines in portions of customer care. In addition, the anticipated declines in the student loan
business and the Texas Medicaid contract termination had a combined 2.6-percentage point negative impact
on BPO revenue growth and a 1.8-percentage point negative impact on total Services revenue. These
negative year-over-year impacts are expected to end in the second half of 2015.
In 2014, BPO revenue mix across the major business areas was as follows: Commercial - 45%;
Government and Transportation - 25%; Commercial Healthcare - 18%; and Government Healthcare -
12%.
•DO revenue increased 2% and represented 32% of total Services revenue. The increase in DO revenue was
primarily driven by growth in our partner print services offerings offset by declines in Europe and other markets
due to contract run-off and new contract ramp timing.
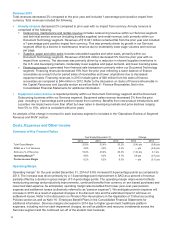
Segment Margin 2014
Services segment margin of 9.0% decreased 1.1-percentage points from the prior year due primarily to a 1.1-
percentage point decline in gross margin, as margin improvements in DO, commercial healthcare, human
resources and commercial European businesses were more than offset by decreased margin in government
healthcare and government and transportation. Productivity improvements and restructuring benefits were
insufficient to offset higher expenses associated with our government healthcare Medicaid and Health Insurance
Exchange (HIX) platforms, net non-cash impairment charges for the HIX platform, higher compensation expenses,
the anticipated run-off of the student loan business and price declines consistent with prior years. The gross
margin decline was partially offset by improvements in SAG reflecting restructuring benefits.
Metrics
Pipeline
Our total Services sales pipeline at December 31, 2014 declined 5% over the prior year. The pipeline has been
adjusted to remove the ITO business and to reflect the realignment of our Services go-to-market resources into
industry focused business groups. Additionally, the pipeline qualification criteria has been revised. The sales
pipeline includes the Total Contract Value (TCV) of new business opportunities that potentially could be contracted
within the next six months and excludes business opportunities with estimated annual recurring revenue in excess
of $100 million.
Xerox 2014 Annual Report 42