Xerox 2014 Annual Report Download - page 72
Download and view the complete annual report
Please find page 72 of the 2014 Xerox annual report below. You can navigate through the pages in the report by either clicking on the pages listed below, or by using the keyword search tool below to find specific information within the annual report.-
 1
1 -
2
-
3
-
4
-
5
-
6
-
7
-
8
-
9
-
10
-
11
-
12
-
13
-
14
-
15
-
16
-
17
-
18
-
19
-
20
-
21
-
22
-
23
-
24
-
25
-
26
-
27
-
28
-
29
-
30
-
31
-
32
-
33
-
34
-
35
-
36
-
37
-
38
-
39
-
40
-
41
-
42
-
43
-
44
-
45
-
46
-
47
-
48
-
49
-
50
-
51
-
52
-
53
-
54
-
55
-
56
-
57
-
58
-
59
-
60
-
61
-
 62
62 -
 63
63 -
 64
64 -
 65
65 -
 66
66 -
 67
67 -
 68
68 -
 69
69 -
 70
70 -
 71
71 -
 72
72 -
 73
73 -
 74
74 -
 75
75 -
 76
76 -
 77
77 -
 78
78 -
 79
79 -
 80
80 -
 81
81 -
 82
82 -
83
-
84
-
85
-
86
-
87
-
88
-
89
-
90
-
91
-
92
-
93
-
94
-
95
-
96
-
97
-
98
-
99
-
100
-
101
-
102
-
103
-
104
-
105
-
106
-
107
-
108
-
109
-
110
-
111
-
112
-
113
-
114
-
115
-
116
-
117
-
118
-
119
-
120
-
121
-
122
-
123
-
124
-
125
-
126
-
127
-
128
-
129
-
130
-
131
-
132
-
133
-
134
-
135
-
136
-
137
-
138
-
139
-
140
-
141
-
142
-
143
-
144
-
145
-
146
-
147
-
148
-
149
-
150
-
151
-
152
 |
 |

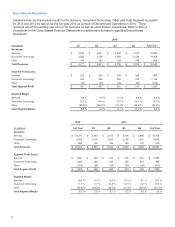
A reconciliation of these non-GAAP financial measures and the most directly comparable measures calculated and
presented in accordance with GAAP are set forth on the following tables.
Adjusted Earnings Measures
To better understand the trends in our business, we believe it is necessary to adjust the following amounts
determined in accordance with GAAP to exclude the effects of the certain items as well as their related income tax
effects.
• Net income and Earnings per share (EPS), and
• Effective tax rate.
The above have been adjusted for the following items:
•Amortization of intangible assets (all periods): The amortization of intangible assets is driven by our
acquisition activity which can vary in size, nature and timing as compared to other companies within our industry
and from period to period. Accordingly, due to the incomparability of acquisition activity among companies and
from period to period, we believe exclusion of the amortization associated with intangible assets acquired
through our acquisitions allows investors to better compare and understand our results. The use of intangible
assets contributed to our revenues earned during the periods presented and will contribute to our future period
revenues as well. Amortization of intangible assets will recur in future periods.
•Other discrete, unusual or infrequent costs and expenses: In addition, we occasionally may also exclude
additional items given the discrete, unusual or infrequent nature of the item on our results of operations for the
period. We believe the exclusion of these items allow investors to better understand and analyze the results for
the period as compared to prior periods as well as expected trends in our business.
Adjustments for 2014, 2013 and 2012 earnings were limited to the amortization of intangible assets.
We also calculate and utilize an Operating income and margin earnings measure by adjusting our pre-tax income
and margin amounts to exclude certain items. In addition to the amortization of intangible assets, operating income
and margin also exclude Other expenses, net as well as Restructuring and asset impairment charges. Other
expenses, net is primarily comprised of non-financing interest expense and also includes certain other non-operating
items. Restructuring and asset impairment charges consist of costs primarily related to severance and benefits for
employees pursuant to formal restructuring and workforce reduction plans. Such charges are expected to yield future
benefits and savings with respect to our operational performance. We exclude all of these amounts in order to
evaluate our current and past operating performance and to better understand the expected future trends in our
business.
Net Income and EPS reconciliation:
Year Ended December 31,
2014 2013 2012
(in millions; except per share amounts) Net Income EPS Net Income EPS Net Income EPS
As Reported(1) $ 1,084 $ 0.90 $ 1,139 $ 0.89 $ 1,152 $0.85
Adjustments:
Amortization of intangible assets 196 0.17 189 0.15 186 0.14
Adjusted $ 1,280 $ 1.07 $ 1,328 $ 1.04 $ 1,338 $0.99
Weighted average shares for adjusted EPS(2) 1,199 1,274 1,356
Fully diluted shares at December 31, 2014(3) 1,159
___________
(1) Net income and EPS from continuing operations attributable to Xerox.
(2) Average shares for the calculation of adjusted EPS include 27 million shares associated with the Series A convertible preferred stock and therefore the related
annual dividend was excluded.
(3) Represents common shares outstanding at December 31, 2014 as well as shares associated with our Series A convertible preferred stock plus dilutive potential
common shares as used for the calculation of diluted earnings per share in the fourth quarter 2014.
57