Xerox 2014 Annual Report Download - page 42
Download and view the complete annual report
Please find page 42 of the 2014 Xerox annual report below. You can navigate through the pages in the report by either clicking on the pages listed below, or by using the keyword search tool below to find specific information within the annual report.-
 1
1 -
2
-
3
-
4
-
5
-
6
-
7
-
8
-
9
-
10
-
11
-
12
-
13
-
14
-
15
-
16
-
17
-
18
-
19
-
20
-
21
-
22
-
23
-
24
-
25
-
26
-
27
-
28
-
29
-
30
-
31
-
 32
32 -
 33
33 -
 34
34 -
 35
35 -
 36
36 -
 37
37 -
 38
38 -
 39
39 -
 40
40 -
 41
41 -
 42
42 -
 43
43 -
 44
44 -
 45
45 -
 46
46 -
 47
47 -
 48
48 -
 49
49 -
 50
50 -
 51
51 -
 52
52 -
53
-
54
-
55
-
56
-
57
-
58
-
59
-
60
-
61
-
62
-
63
-
64
-
65
-
66
-
67
-
68
-
69
-
70
-
71
-
72
-
73
-
74
-
75
-
76
-
77
-
78
-
79
-
80
-
81
-
82
-
83
-
84
-
85
-
86
-
87
-
88
-
89
-
90
-
91
-
92
-
93
-
94
-
95
-
96
-
97
-
98
-
99
-
100
-
101
-
102
-
103
-
104
-
105
-
106
-
107
-
108
-
109
-
110
-
111
-
112
-
113
-
114
-
115
-
116
-
117
-
118
-
119
-
120
-
121
-
122
-
123
-
124
-
125
-
126
-
127
-
128
-
129
-
130
-
131
-
132
-
133
-
134
-
135
-
136
-
137
-
138
-
139
-
140
-
141
-
142
-
143
-
144
-
145
-
146
-
147
-
148
-
149
-
150
-
151
-
152
 |
 |
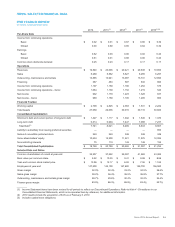
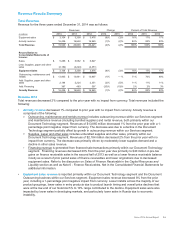
Cash flow from operations was $2.1 billion in 2014 as compared to $2.4 billion in 2013. The decrease in cash was
primarily due to the impacts from the prior year finance receivables sales and higher pension contributions. These
decreases were partially offset by working capital improvements (accounts receivable, inventory and accounts
payable), lower contract spending and lower income tax payments. Cash used in investing activities of $703 million
primarily reflects capital expenditures of $452 million and acquisitions of $340 million partially offset by proceeds
from the sale of businesses and assets of $80 million. Cash used in financing activities was $1.6 billion, which
primarily reflects $1.1 billion for stock repurchases, $175 million of net payments on debt and $313 million for
dividends.
We reported a net loss from discontinued operations in 2014 of $115 million primarily related to the loss on the
pending disposal of the ITO business as previously noted. Refer to Note 4 - Divestitures in our Consolidated
Financial Statements for additional information regarding discontinued operations.
2015 Outlook
We expect total revenues to be flat in 2015, excluding the impact of currency. We expect currency to have about a 3
to 4 percentage point negative impact on total revenues in 2015, reflecting the significant weakening of our major
foreign currencies against the U.S. dollar. Earnings in 2015 are likewise expected to be negatively impacted by
translation currency as well as higher pension costs.
In our Services business, we expect revenue growth between 2 and 4%, excluding the impact of currency, with
revenue growth improving through the year. Revenue growth is expected to be driven by portfolio management,
global expansion, sales investments to acquire new customers and increase our revenue with current customers
and additional acquisitions which increase our service capabilities and global footprint. Services margins are
expected to improve approximately 0.5-percentage points in 2015 as we continue to focus on portfolio mix as well
as productivity and cost improvements.
In our Document Technology business, we expect revenue to decline 4 to 5%, excluding the impact of currency,
reflecting improvements from second half 2014 product launches and moderation of the negative impact from prior
period finance receivable sales. We also expect to capitalize on growth opportunities in the most advantaged
segments of the market including color, high-end graphic communications and SMB markets. Margins in Document
Technology are expected to be in the range of 11 to 13%, down from the 2014 margin of 13.7%, reflecting higher
pension costs and negative impacts from translation currency partially offset by our continued focus on productivity
and cost improvements.
Our capital allocation plan for 2015 includes the following:
• Share repurchase – we plan to spend about $1 billion on share repurchases.
• Acquisitions – we expect to spend up to $900 million. In keeping with our portfolio management strategy, we are
focusing on acquiring companies that will expand our capabilities in attractive services areas as well as extend
our global reach in Services. Despite the increased capital allocation for acquisitions, we will maintain the
disciplined approach we have established for evaluating and completing acquisitions.
• Debt – we are comfortable with our leverage position and expect to end the year with debt about flat at $7.7
billion.
• Dividends - we recently announced a 12% increase in the quarterly dividend to 7 cents per share effective with
our April 30th dividend. This will result in common dividends of just over $300 million in 2015, which is only
modestly higher than the prior year as share repurchases effectively self-fund the increase.
27