Xerox 2014 Annual Report Download - page 118
Download and view the complete annual report
Please find page 118 of the 2014 Xerox annual report below. You can navigate through the pages in the report by either clicking on the pages listed below, or by using the keyword search tool below to find specific information within the annual report.-
 1
1 -
2
-
3
-
4
-
5
-
6
-
7
-
8
-
9
-
10
-
11
-
12
-
13
-
14
-
15
-
16
-
17
-
18
-
19
-
20
-
21
-
22
-
23
-
24
-
25
-
26
-
27
-
28
-
29
-
30
-
31
-
32
-
33
-
34
-
35
-
36
-
37
-
38
-
39
-
40
-
41
-
42
-
43
-
44
-
45
-
46
-
47
-
48
-
49
-
50
-
51
-
52
-
53
-
54
-
55
-
56
-
57
-
58
-
59
-
60
-
61
-
62
-
63
-
64
-
65
-
66
-
67
-
68
-
69
-
70
-
71
-
72
-
73
-
74
-
75
-
76
-
77
-
78
-
79
-
80
-
81
-
82
-
83
-
84
-
85
-
86
-
87
-
88
-
89
-
90
-
91
-
92
-
93
-
94
-
95
-
96
-
97
-
98
-
99
-
100
-
101
-
102
-
103
-
104
-
105
-
106
-
107
-
 108
108 -
 109
109 -
 110
110 -
 111
111 -
 112
112 -
 113
113 -
 114
114 -
 115
115 -
 116
116 -
 117
117 -
 118
118 -
 119
119 -
 120
120 -
 121
121 -
 122
122 -
 123
123 -
 124
124 -
 125
125 -
 126
126 -
 127
127 -
 128
128 -
129
-
130
-
131
-
132
-
133
-
134
-
135
-
136
-
137
-
138
-
139
-
140
-
141
-
142
-
143
-
144
-
145
-
146
-
147
-
148
-
149
-
150
-
151
-
152
 |
 |

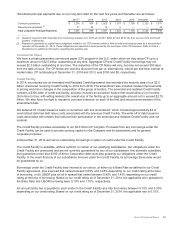
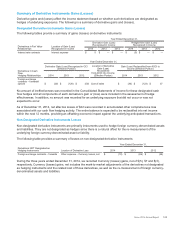
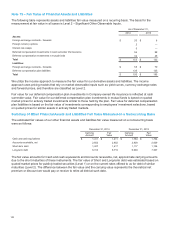
Note 15 – Fair Value of Financial Assets and Liabilities
The following table represents assets and liabilities fair value measured on a recurring basis. The basis for the
measurement at fair value in all cases is Level 2 – Significant Other Observable Inputs.
As of December 31,
2014 2013
Assets:
Foreign exchange contracts - forwards $20$ 6
Foreign currency options 2—
Interest rate swaps 5—
Deferred compensation investments in cash surrender life insurance 94 88
Deferred compensation investments in mutual funds 32 28
Total $153 $122
Liabilities:
Foreign exchange contracts - forwards $58$70
Deferred compensation plan liabilities 135 125
Total $193 $195
We utilize the income approach to measure the fair value for our derivative assets and liabilities. The income
approach uses pricing models that rely on market observable inputs such as yield curves, currency exchange rates
and forward prices, and therefore are classified as Level 2.
Fair value for our deferred compensation plan investments in Company-owned life insurance is reflected at cash
surrender value. Fair value for our deferred compensation plan investments in mutual funds is based on quoted
market prices for actively traded investments similar to those held by the plan. Fair value for deferred compensation
plan liabilities is based on the fair value of investments corresponding to employees’ investment selections, based
on quoted prices for similar assets in actively traded markets.
Summary of Other Financial Assets and Liabilities Fair Value Measured on a Nonrecurring Basis
The estimated fair values of our other financial assets and liabilities fair value measured on a nonrecurring basis
were as follows:
December 31, 2014 December 31, 2013
Carrying
Amount
Fair
Value
Carrying
Amount
Fair
Value
Cash and cash equivalents $1,411 $1,411 $1,764 $1,764
Accounts receivable, net 2,652 2,652 2,929 2,929
Short-term debt 1,427 1,417 1,117 1,126
Long-term debt 6,314 6,719 6,904 7,307
The fair value amounts for Cash and cash equivalents and Accounts receivable, net, approximate carrying amounts
due to the short maturities of these instruments. The fair value of Short and Long-term debt was estimated based on
quoted market prices for publicly traded securities (Level 1) or on the current rates offered to us for debt of similar
maturities (Level 2). The difference between the fair value and the carrying value represents the theoretical net
premium or discount we would pay or receive to retire all debt at such date.
103