Xerox 2014 Annual Report Download - page 62
Download and view the complete annual report
Please find page 62 of the 2014 Xerox annual report below. You can navigate through the pages in the report by either clicking on the pages listed below, or by using the keyword search tool below to find specific information within the annual report.-
 1
1 -
2
-
3
-
4
-
5
-
6
-
7
-
8
-
9
-
10
-
11
-
12
-
13
-
14
-
15
-
16
-
17
-
18
-
19
-
20
-
21
-
22
-
23
-
24
-
25
-
26
-
27
-
28
-
29
-
30
-
31
-
32
-
33
-
34
-
35
-
36
-
37
-
38
-
39
-
40
-
41
-
42
-
43
-
44
-
45
-
46
-
47
-
48
-
49
-
50
-
51
-
 52
52 -
 53
53 -
 54
54 -
 55
55 -
 56
56 -
 57
57 -
 58
58 -
 59
59 -
 60
60 -
 61
61 -
 62
62 -
 63
63 -
 64
64 -
 65
65 -
 66
66 -
 67
67 -
 68
68 -
 69
69 -
 70
70 -
 71
71 -
 72
72 -
73
-
74
-
75
-
76
-
77
-
78
-
79
-
80
-
81
-
82
-
83
-
84
-
85
-
86
-
87
-
88
-
89
-
90
-
91
-
92
-
93
-
94
-
95
-
96
-
97
-
98
-
99
-
100
-
101
-
102
-
103
-
104
-
105
-
106
-
107
-
108
-
109
-
110
-
111
-
112
-
113
-
114
-
115
-
116
-
117
-
118
-
119
-
120
-
121
-
122
-
123
-
124
-
125
-
126
-
127
-
128
-
129
-
130
-
131
-
132
-
133
-
134
-
135
-
136
-
137
-
138
-
139
-
140
-
141
-
142
-
143
-
144
-
145
-
146
-
147
-
148
-
149
-
150
-
151
-
152
 |
 |

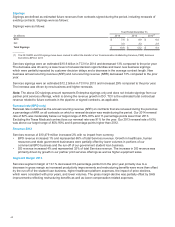
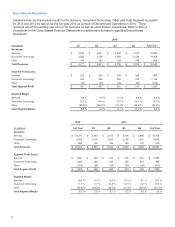
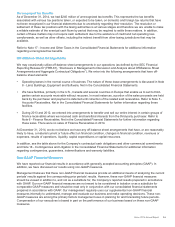
Discontinued Operations
Detailed below are the revised results for the Services, Document Technology, Other and Total Segment by quarter
for 2014 and 2013 as well as for the full-year 2012 as a result of Discontinued Operations in 2014. These
revisions reflect the pending sale of our ITO business as well as other smaller divestitures. Refer to Note 4 -
Divestitures in the Consolidated Financial Statements for additional information regarding Discontinued
Operations.
2014
(in millions) Q1 Q2 Q3 Q4 Full Year
Revenues
Services $ 2,585 $ 2,651 $ 2,623 $ 2,725 10,584
Document Technology 2,044 2,126 2,029 2,159 8,358
Other 142 164 143 149 598
Total Revenues $ 4,771 $ 4,941 $ 4,795 $ 5,033 $ 19,540
Segment Profit (Loss)
Services $ 222 $ 226 $ 240 $ 268 956
Document Technology 249 306 284 310 1,149
Other (50) (75) (82) (65) (272)
Total Segment Profit $ 421 $ 457 $ 442 $ 513 $ 1,833
Segment Margin
Services 8.6 % 8.5 % 9.1 % 9.8 % 9.0 %
Document Technology 12.2 % 14.4 % 14.0 % 14.4 % 13.7 %
Other (35.2)% (45.7)% (57.3)% (43.6)% (45.5)%
Total Segment Margin 8.8 % 9.2 % 9.2 % 10.2 %9.4%
2012 2013
(in millions) Full Year Q1 Q2 Q3 Q4 Full Year
Revenues
Services $ 10,271 $ 2,584 $ 2,613 $ 2,596 $ 2,686 $ 10,479
Document Technology 9,462 2,135 2,263 2,159 2,351 8,908
Other 688 138 166 145 170 619
Total Revenues $ 20,421 $ 4,857 $ 5,042 $ 4,900 $ 5,207 $ 20,006
Segment Profit (Loss)
Services $ 1,091 $ 250 $ 276 $ 268 $ 261 $ 1,055
Document Technology 1,065 186 245 260 273 964
Other (254)(68)(61)(54)(34) (217)
Total Segment Profit $1,902 $ 368 $ 460 $ 474 $ 500 $ 1,802
Segment Margin
Services 10.6 % 9.7 % 10.6 % 10.3 % 9.7 % 10.1 %
Document Technology 11.3 % 8.7 % 10.8 % 12.0 % 11.6 %10.8%
Other (36.9)% (49.3)% (36.7)% (37.2)% (20.0)% (35.1)%
Total Segment Margin 9.3 % 7.6 % 9.1 % 9.7 % 9.6 % 9.0 %
47