Xerox 2014 Annual Report Download - page 73
Download and view the complete annual report
Please find page 73 of the 2014 Xerox annual report below. You can navigate through the pages in the report by either clicking on the pages listed below, or by using the keyword search tool below to find specific information within the annual report.-
 1
1 -
2
-
3
-
4
-
5
-
6
-
7
-
8
-
9
-
10
-
11
-
12
-
13
-
14
-
15
-
16
-
17
-
18
-
19
-
20
-
21
-
22
-
23
-
24
-
25
-
26
-
27
-
28
-
29
-
30
-
31
-
32
-
33
-
34
-
35
-
36
-
37
-
38
-
39
-
40
-
41
-
42
-
43
-
44
-
45
-
46
-
47
-
48
-
49
-
50
-
51
-
52
-
53
-
54
-
55
-
56
-
57
-
58
-
59
-
60
-
61
-
62
-
 63
63 -
 64
64 -
 65
65 -
 66
66 -
 67
67 -
 68
68 -
 69
69 -
 70
70 -
 71
71 -
 72
72 -
 73
73 -
 74
74 -
 75
75 -
 76
76 -
 77
77 -
 78
78 -
 79
79 -
 80
80 -
 81
81 -
 82
82 -
 83
83 -
84
-
85
-
86
-
87
-
88
-
89
-
90
-
91
-
92
-
93
-
94
-
95
-
96
-
97
-
98
-
99
-
100
-
101
-
102
-
103
-
104
-
105
-
106
-
107
-
108
-
109
-
110
-
111
-
112
-
113
-
114
-
115
-
116
-
117
-
118
-
119
-
120
-
121
-
122
-
123
-
124
-
125
-
126
-
127
-
128
-
129
-
130
-
131
-
132
-
133
-
134
-
135
-
136
-
137
-
138
-
139
-
140
-
141
-
142
-
143
-
144
-
145
-
146
-
147
-
148
-
149
-
150
-
151
-
152
 |
 |

Effective Tax reconciliation:
Year Ended December 31, 2014 Year Ended December 31, 2013 Year Ended December 31, 2012
(in millions)
Pre-Tax
Income
Income Tax
Expense
Effective
Tax Rate
Pre-Tax
Income
Income Tax
Expense
Effective
Tax Rat e
Pre-Tax
Income
Income Tax
Expense
Effective
Tax Rate
As Reported(1) $ 1,206 $ 259 21.5% $ 1,243 $ 253 20.4% $ 1,284 $ 256 19.9%
Adjustments:
Amortization of intangible assets 315 119 305 116 301 115
Adjusted $ 1,521 $ 378 24.9% $ 1,548 $ 369 23.8% $ 1,585 $ 371 23.4%
__________
(1) Pre-tax income and income tax expense from continuing operations attributable to Xerox.
Operating Income / Margin reconciliation:
Year Ended December 31, 2014 Year Ended December 31, 2013 Year Ended December 31, 2012
(in millions) Profit Revenue Margin Profit Revenue Margin Profit Revenue Margin
Reported Pre-tax Income(1) $ 1,206 $ 19,540 6.2% $ 1,243 $ 20,006 6.2% $ 1,284 $ 20,421 6.3%
Adjustments:
Amortization of intangible assets 315 305 301
Xerox restructuring charge 128 115 149
Other expenses, net 232 146 257
Adjusted Operating Income /
Margin 1,881 19,540 9.6% 1,809 20,006 9.0% 1,991 20,421 9.7%
Equity in net income of unconsolidated
affiliates 160 169 152
Business transformation costs(2) 21 — —
Fuji Xerox restructuring charge 3 9 16
Litigation matters — (37) —
Other expense, net* (232) (148) (257)
Segment Profit / Margin $ 1,833 $ 19,540 9.4% $ 1,802 $ 20,006 9.0% $ 1,902 $ 20,421 9.3%
____________
* Includes rounding adjustments.
(1) Profit and revenue from continuing operations attributable to Xerox.
(2) Business transformation costs represent incremental costs incurred directly in support of our business transformation and restructuring initiatives such as
compensation costs for overlapping staff, consulting costs and training costs.
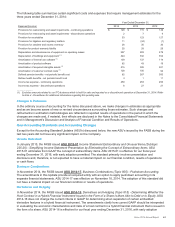
ITEM 7A. QUANTITATIVE AND QUALITATIVE DISCLOSURES ABOUT MARKET RISK
Financial Risk Management
We are exposed to market risk from foreign currency exchange rates and interest rates, which could affect
operating results, financial position and cash flows. We manage our exposure to these market risks through our
regular operating and financing activities and, when appropriate, through the use of derivative financial instruments.
We utilized derivative financial instruments to hedge economic exposures, as well as reduce earnings and cash flow
volatility resulting from shifts in market rates.
Recent market events have not caused us to materially modify or change our financial risk management strategies
with respect to our exposures to interest rate and foreign currency risk. Refer to Note 14 - Financial Instruments in
the Consolidated Financial Statements for additional discussion on our financial risk management.
Xerox 2014 Annual Report 58