Xerox 2014 Annual Report Download - page 53
Download and view the complete annual report
Please find page 53 of the 2014 Xerox annual report below. You can navigate through the pages in the report by either clicking on the pages listed below, or by using the keyword search tool below to find specific information within the annual report.-
 1
1 -
2
-
3
-
4
-
5
-
6
-
7
-
8
-
9
-
10
-
11
-
12
-
13
-
14
-
15
-
16
-
17
-
18
-
19
-
20
-
21
-
22
-
23
-
24
-
25
-
26
-
27
-
28
-
29
-
30
-
31
-
32
-
33
-
34
-
35
-
36
-
37
-
38
-
39
-
40
-
41
-
42
-
 43
43 -
 44
44 -
 45
45 -
 46
46 -
 47
47 -
 48
48 -
 49
49 -
 50
50 -
 51
51 -
 52
52 -
 53
53 -
 54
54 -
 55
55 -
 56
56 -
 57
57 -
 58
58 -
 59
59 -
 60
60 -
 61
61 -
 62
62 -
 63
63 -
64
-
65
-
66
-
67
-
68
-
69
-
70
-
71
-
72
-
73
-
74
-
75
-
76
-
77
-
78
-
79
-
80
-
81
-
82
-
83
-
84
-
85
-
86
-
87
-
88
-
89
-
90
-
91
-
92
-
93
-
94
-
95
-
96
-
97
-
98
-
99
-
100
-
101
-
102
-
103
-
104
-
105
-
106
-
107
-
108
-
109
-
110
-
111
-
112
-
113
-
114
-
115
-
116
-
117
-
118
-
119
-
120
-
121
-
122
-
123
-
124
-
125
-
126
-
127
-
128
-
129
-
130
-
131
-
132
-
133
-
134
-
135
-
136
-
137
-
138
-
139
-
140
-
141
-
142
-
143
-
144
-
145
-
146
-
147
-
148
-
149
-
150
-
151
-
152
 |
 |

•$141 million of severance costs related to headcount reductions of approximately 4,800 employees globally.
The actions impacted several functional areas, with approximately 65% of the costs focused on gross margin
improvements, 34% on SAG and 1% on the optimization of RD&E investments.
•$2 million for lease termination costs primarily reflecting continued optimization of our worldwide operating
locations.
• $1 million of asset impairment losses.
The above charges were partially offset by $29 million of net reversals for changes in estimated reserves from prior
period initiatives.
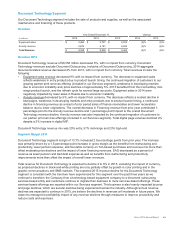
Restructuring Summary
The restructuring reserve balance as of December 31, 2014 for all programs was $97 million, of which
approximately $94 million is expected to be spent over the next twelve months. In the first quarter 2015, we expect
to incur additional restructuring charges of approximately $0.02 per diluted share for actions and initiatives that have
not yet been finalized.
Refer to Note 11 - Restructuring and Asset Impairment Charges in the Consolidated Financial Statements for
additional information regarding our restructuring programs.
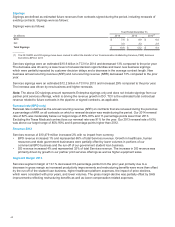
Amortization of Intangible Assets
During the year ended December 31, 2014, we recorded $315 million of expense related to the amortization of
intangible assets, which is $10 million higher than the prior year reflecting an increase in acquisitions in 2014.
During the year ended December 31, 2013, we recorded $305 million of expense related to the amortization of
intangible assets, which was $4 million higher than the prior year reflecting the increase in acquisitions in 2012.
Refer to Note 10 - Goodwill and Intangible assets, Net in the Consolidated Financial Statements for additional
information regarding our intangible assets.
Worldwide Employment
Worldwide employment of approximately 147,500 as of December 31, 2014 increased by approximately 4,400 from
December 31, 2013, due primarily to the impact of acquisitions and seasonal fluctuations in Services, partially offset
by restructuring actions and productivity improvements. Total headcount includes approximately 9,800 employees
who are expected to transfer to Atos upon closure of the sale of our ITO business. Worldwide employment was
approximately 143,100 and 147,600 at December 2013 and 2012, respectively.
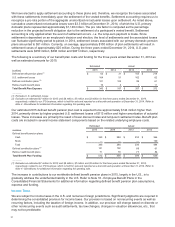
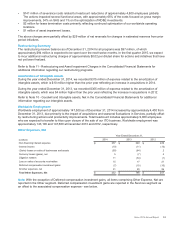
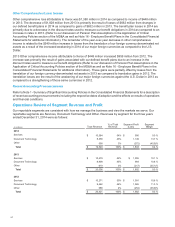
Other Expenses, Net
Year Ended December 31,
(in millions) 2014 2013 2012
Non-financing interest expense $237 $240 $229
Interest income (10)(11)(13)
(Gains) losses on sales of businesses and assets (50)(64)2
Currency losses (gains), net 5(7) 3
Litigation matters 11 (34)(1)
Loss on sales of accounts receivables 15 17 21
Deferred compensation investment gains (7) (15)(10)
All other expenses, net 31 20 26
Total Other Expenses, Net $232 $146 $257
Note: With the exception of Deferred compensation investment gains, all items comprising Other Expense, Net are
reported in the Other segment. Deferred compensation investment gains are reported in the Services segment as
an offset to the associated compensation expense - see below.
Xerox 2014 Annual Report 38