Xerox 2014 Annual Report Download - page 125
Download and view the complete annual report
Please find page 125 of the 2014 Xerox annual report below. You can navigate through the pages in the report by either clicking on the pages listed below, or by using the keyword search tool below to find specific information within the annual report.-
 1
1 -
2
-
3
-
4
-
5
-
6
-
7
-
8
-
9
-
10
-
11
-
12
-
13
-
14
-
15
-
16
-
17
-
18
-
19
-
20
-
21
-
22
-
23
-
24
-
25
-
26
-
27
-
28
-
29
-
30
-
31
-
32
-
33
-
34
-
35
-
36
-
37
-
38
-
39
-
40
-
41
-
42
-
43
-
44
-
45
-
46
-
47
-
48
-
49
-
50
-
51
-
52
-
53
-
54
-
55
-
56
-
57
-
58
-
59
-
60
-
61
-
62
-
63
-
64
-
65
-
66
-
67
-
68
-
69
-
70
-
71
-
72
-
73
-
74
-
75
-
76
-
77
-
78
-
79
-
80
-
81
-
82
-
83
-
84
-
85
-
86
-
87
-
88
-
89
-
90
-
91
-
92
-
93
-
94
-
95
-
96
-
97
-
98
-
99
-
100
-
101
-
102
-
103
-
104
-
105
-
106
-
107
-
108
-
109
-
110
-
111
-
112
-
113
-
114
-
 115
115 -
 116
116 -
 117
117 -
 118
118 -
 119
119 -
 120
120 -
 121
121 -
 122
122 -
 123
123 -
 124
124 -
 125
125 -
 126
126 -
 127
127 -
 128
128 -
 129
129 -
 130
130 -
 131
131 -
 132
132 -
 133
133 -
 134
134 -
 135
135 -
136
-
137
-
138
-
139
-
140
-
141
-
142
-
143
-
144
-
145
-
146
-
147
-
148
-
149
-
150
-
151
-
152
 |
 |

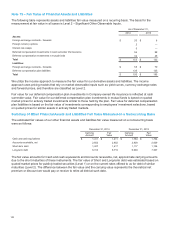
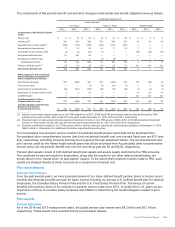
Estimated Future Benefit Payments
The following benefit payments, which reflect expected future service, as appropriate, are expected to be paid
during the following years:
Pension Benefits
U.S. Non-U.S. Total Retiree Health
2015 $ 643 $251 $894 $71
2016 343 252 595 70
2017 336 261 597 70
2018 333 269 602 69
2019 326 279 605 68
Years 2020-2023 1,681 1,539 3,220 323
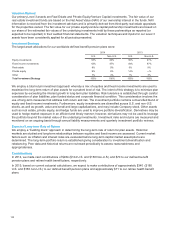
Assumptions
Weighted-average assumptions used to determine benefit obligations at the plan measurement dates:
Pension Benefits
2014 2013 2012
U.S. Non-U.S. U.S. Non-U.S. U.S. Non-U.S.
Discount rate 3.9% 3.1% 4.8% 4.2% 3.7% 4.0%
Rate of compensation increase 0.2% 2.6% 0.2% 2.7% 0.2% 2.6%
Retiree Health
2014 2013 2012
Discount rate 3.8% 4.5% 3.6%
Weighted-average assumptions used to determine net periodic benefit cost for years ended December 31:
Pension Benefits
2015 2014 2013 2012
U.S. Non-U.S. U.S. Non-U.S. U.S. Non-U.S. U.S. Non-U.S.
Discount rate 3.9% 3.1% 4.8% 4.2% 3.7% 4.0% 4.8% 4.6%
Expected return on plan assets 7.5% 5.2% 7.8% 6.1% 7.8% 6.1% 7.8% 6.2%
Rate of compensation increase 0.2% 2.6% 0.2% 2.7% 0.2% 2.6% 3.5% 2.7%
Retiree Health
2015 2014 2013 2012
Discount rate 3.8% 4.5% 3.6% 4.5%
_____________________________
Note: Expected return on plan assets is not applicable to retiree health benefits as these plans are not funded.Rate of compensation increase is
not applicable to retiree health benefits as compensation levels do not impact earned benefits.
Assumed health care cost trend rates were as follows:
December 31,
2014 2013
Health care cost trend rate assumed for next year 7.0% 7.2%
Rate to which the cost trend rate is assumed to decline (the ultimate trend rate) 4.9% 4.9%
Year that the rate reaches the ultimate trend rate 2023 2023
Xerox 2014 Annual Report 110