Xerox 2014 Annual Report Download - page 139
Download and view the complete annual report
Please find page 139 of the 2014 Xerox annual report below. You can navigate through the pages in the report by either clicking on the pages listed below, or by using the keyword search tool below to find specific information within the annual report.-
 1
1 -
2
-
3
-
4
-
5
-
6
-
7
-
8
-
9
-
10
-
11
-
12
-
13
-
14
-
15
-
16
-
17
-
18
-
19
-
20
-
21
-
22
-
23
-
24
-
25
-
26
-
27
-
28
-
29
-
30
-
31
-
32
-
33
-
34
-
35
-
36
-
37
-
38
-
39
-
40
-
41
-
42
-
43
-
44
-
45
-
46
-
47
-
48
-
49
-
50
-
51
-
52
-
53
-
54
-
55
-
56
-
57
-
58
-
59
-
60
-
61
-
62
-
63
-
64
-
65
-
66
-
67
-
68
-
69
-
70
-
71
-
72
-
73
-
74
-
75
-
76
-
77
-
78
-
79
-
80
-
81
-
82
-
83
-
84
-
85
-
86
-
87
-
88
-
89
-
90
-
91
-
92
-
93
-
94
-
95
-
96
-
97
-
98
-
99
-
100
-
101
-
102
-
103
-
104
-
105
-
106
-
107
-
108
-
109
-
110
-
111
-
112
-
113
-
114
-
115
-
116
-
117
-
118
-
119
-
120
-
121
-
122
-
123
-
124
-
125
-
126
-
127
-
128
-
 129
129 -
 130
130 -
 131
131 -
 132
132 -
 133
133 -
 134
134 -
 135
135 -
 136
136 -
 137
137 -
 138
138 -
 139
139 -
 140
140 -
 141
141 -
 142
142 -
 143
143 -
 144
144 -
 145
145 -
 146
146 -
 147
147 -
 148
148 -
 149
149 -
150
-
151
-
152
 |
 |

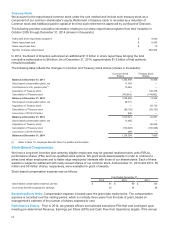
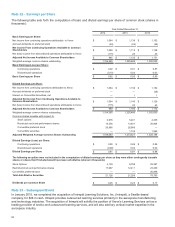
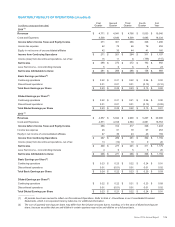
QUARTERLY RESULTS OF OPERATIONS (Unaudited)
(in millions, except per-share data)
First
Quarter
Second
Quarter
Third
Quarter
Fourth
Quarter
Full
Year
2014 (1)
Revenues $4,771 $4,941 $4,795 $5,033 $19,540
Costs and Expenses 4,500 4,640 4,509 4,685 18,334
Income before Income Taxes and Equity Income 271 301 286 348 1,206
Income tax expense 42 73 66 78 259
Equity in net income of unconsolidated affiliates 42 33 44 41 160
Income from Continuing Operations $271 $261 $264 $311 $1,107
Income (loss) from discontinued operations, net of tax 15 11 8 (149)(115)
Net Income $286 $272 $272 $162 $992
Less: Net income - noncontrolling interests 5 6 6 623
Net Income Attributable to Xerox $281 $266 $266 $156 $969
Basic Earnings per Share(2):
Continuing operations $ 0.22 $0.21 $0.22 $0.26 $0.92
Discontinued operations 0.01 0.01 0.01 (0.13)(0.10)
Total Basic Earnings per Share $0.23 $0.22 $0.23 $0.13 $0.82
Diluted Earnings per Share(2):
Continuing operations $ 0.22 $0.21 $0.21 $0.26 $0.90
Discontinued operations 0.01 0.01 0.01 (0.13)(0.09)
Total Diluted Earnings per Share $0.23 $0.22 $0.22 $0.13 $0.81
2013 (1)
Revenues $4,857 $5,042 $4,900 $5,207 $20,006
Costs and Expenses 4,571 4,728 4,583 4,881 18,763
Income before Income Taxes and Equity Income 286 314 317 326 1,243
Income tax expense 46 61 79 67 253
Equity in net income of unconsolidated affiliates 47 36 43 43 169
Income from Continuing Operations $287 $289 $281 $302 $1,159
Income (loss) from discontinued operations, net of tax 13 (12)10 920
Net Income $300 $277 $291 $311 $1,179
Less: Net income - noncontrolling interests 4 6 5 520
Net Income Attributable to Xerox $296 $271 $286 $306 $1,159
Basic Earnings per Share(2):
Continuing operations $ 0.23 $0.23 $0.22 $0.24 $0.91
Discontinued operations 0.01 (0.01)0.01 0.01 0.02
Total Basic Earnings per Share: $0.24 $0.22 $0.23 $0.25 $0.93
Diluted Earnings per Share(2):
Continuing operations $ 0.22 $0.22 $0.21 $0.23 $0.89
Discontinued operations 0.01 (0.01)0.01 0.01 0.02
Total Diluted Earnings per Share $0.23 $0.21 $0.22 $0.24 $0.91
_________________
(1) All periods have been revised to reflect our Discontinued Operations. Refer to Note 4 - Divestitures in our Consolidated Financial
Statements, which is incorporated here by reference, for additional information.
(2) The sum of quarterly earnings per share may differ from the full-year amounts due to rounding, or in the case of diluted earnings per
share, because securities that are anti-dilutive in certain quarters may not be anti-dilutive on a full-year basis.
Xerox 2014 Annual Report 124