Xerox 2014 Annual Report Download - page 58
Download and view the complete annual report
Please find page 58 of the 2014 Xerox annual report below. You can navigate through the pages in the report by either clicking on the pages listed below, or by using the keyword search tool below to find specific information within the annual report.-
 1
1 -
2
-
3
-
4
-
5
-
6
-
7
-
8
-
9
-
10
-
11
-
12
-
13
-
14
-
15
-
16
-
17
-
18
-
19
-
20
-
21
-
22
-
23
-
24
-
25
-
26
-
27
-
28
-
29
-
30
-
31
-
32
-
33
-
34
-
35
-
36
-
37
-
38
-
39
-
40
-
41
-
42
-
43
-
44
-
45
-
46
-
47
-
 48
48 -
 49
49 -
 50
50 -
 51
51 -
 52
52 -
 53
53 -
 54
54 -
 55
55 -
 56
56 -
 57
57 -
 58
58 -
 59
59 -
 60
60 -
 61
61 -
 62
62 -
 63
63 -
 64
64 -
 65
65 -
 66
66 -
 67
67 -
 68
68 -
69
-
70
-
71
-
72
-
73
-
74
-
75
-
76
-
77
-
78
-
79
-
80
-
81
-
82
-
83
-
84
-
85
-
86
-
87
-
88
-
89
-
90
-
91
-
92
-
93
-
94
-
95
-
96
-
97
-
98
-
99
-
100
-
101
-
102
-
103
-
104
-
105
-
106
-
107
-
108
-
109
-
110
-
111
-
112
-
113
-
114
-
115
-
116
-
117
-
118
-
119
-
120
-
121
-
122
-
123
-
124
-
125
-
126
-
127
-
128
-
129
-
130
-
131
-
132
-
133
-
134
-
135
-
136
-
137
-
138
-
139
-
140
-
141
-
142
-
143
-
144
-
145
-
146
-
147
-
148
-
149
-
150
-
151
-
152
 |
 |

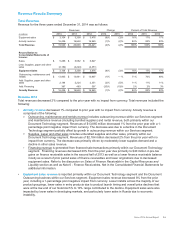
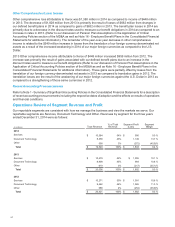
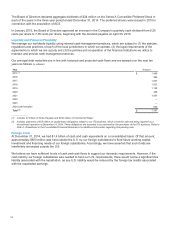
Signings
Signings are defined as estimated future revenues from contracts signed during the period, including renewals of
existing contracts. Signings were as follows:
Signings were as follows:
Year Ended December 31,
(in billions) 2014 2013 2012(1)
BPO $ 7.6 $ 8.9 $ 6.5
DO 3.0 3.3 2.9
Total Signings $10.6 $12.2 $9.4
_________
(1) The 2012 BPO and DO signings have been revised to reflect the transfer of our Communication & Marketing Services (CMS) business
from DO to BPO in 2013.
Services signings were an estimated $10.6 billion in TCV for 2014 and decreased 13% compared to the prior year.
The decrease was driven by a lower level of renewal decision opportunities and lower new business signings
which were partially impacted by customer decision delays and a decrease in the average contract length. New
business annual recurring revenue (ARR) and non-recurring revenue (NRR) decreased 13% compared to the prior
year.
Services signings were an estimated $12.2 billion in TCV for 2013 and increased 29% compared to the prior year.
The increase was driven by new business and higher renewals.
Note: The above DO signings amount represents Enterprise signings only and does not include signings from our
partner print services offerings, which is driving the revenue growth in DO. TCV is the estimated total contractual
revenue related to future contracts in the pipeline or signed contracts, as applicable.
Renewal rate (BPO only)
Renewal rate is defined as the annual recurring revenue (ARR) on contracts that are renewed during the period as
a percentage of ARR on all contracts on which a renewal decision was made during the period. Our 2014 renewal
rate of 82% was moderately below our target range of 85%-90% and 11-percentage points lower than 2013.
Excluding the Texas Medicaid contract loss our renewal rate was 91% for the year. Our 2013 renewal rate of 93%
was above our target range of 85%-90% and 8-percentage points higher than 2012.
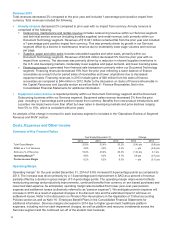
Revenue 2013
Services revenue of $10,479 million increased 2% with no impact from currency.
• BPO revenue increased 1% and represented 68% of total Services revenue. Growth in healthcare, human
resources and state government businesses were partially offset by lower volumes in portions of our
commercial BPO business and the run-off of our government student loan business.
• DO revenue increased 4% and represented 32% of total Services revenue. The increase in DO revenue was
primarily driven by growth in our partner print services offerings as well as higher equipment sales.
Segment Margin 2013
Services segment margin of 10.1% decreased 0.5-percentage points from the prior year primarily due to a
decrease in gross margin as increased productivity improvements and restructuring benefits were more than offset
by the run-off of the student loan business, higher healthcare platform expenses, the impact of price declines,
which were consistent with prior years, and lower volumes. The gross margin decline was partially offset by SAG
improvements reflecting restructuring benefits as well as lower compensation-related expenses.
43