Xerox 2014 Annual Report Download - page 56
Download and view the complete annual report
Please find page 56 of the 2014 Xerox annual report below. You can navigate through the pages in the report by either clicking on the pages listed below, or by using the keyword search tool below to find specific information within the annual report.-
 1
1 -
2
-
3
-
4
-
5
-
6
-
7
-
8
-
9
-
10
-
11
-
12
-
13
-
14
-
15
-
16
-
17
-
18
-
19
-
20
-
21
-
22
-
23
-
24
-
25
-
26
-
27
-
28
-
29
-
30
-
31
-
32
-
33
-
34
-
35
-
36
-
37
-
38
-
39
-
40
-
41
-
42
-
43
-
44
-
45
-
 46
46 -
 47
47 -
 48
48 -
 49
49 -
 50
50 -
 51
51 -
 52
52 -
 53
53 -
 54
54 -
 55
55 -
 56
56 -
 57
57 -
 58
58 -
 59
59 -
 60
60 -
 61
61 -
 62
62 -
 63
63 -
 64
64 -
 65
65 -
 66
66 -
67
-
68
-
69
-
70
-
71
-
72
-
73
-
74
-
75
-
76
-
77
-
78
-
79
-
80
-
81
-
82
-
83
-
84
-
85
-
86
-
87
-
88
-
89
-
90
-
91
-
92
-
93
-
94
-
95
-
96
-
97
-
98
-
99
-
100
-
101
-
102
-
103
-
104
-
105
-
106
-
107
-
108
-
109
-
110
-
111
-
112
-
113
-
114
-
115
-
116
-
117
-
118
-
119
-
120
-
121
-
122
-
123
-
124
-
125
-
126
-
127
-
128
-
129
-
130
-
131
-
132
-
133
-
134
-
135
-
136
-
137
-
138
-
139
-
140
-
141
-
142
-
143
-
144
-
145
-
146
-
147
-
148
-
149
-
150
-
151
-
152
 |
 |

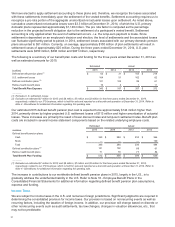
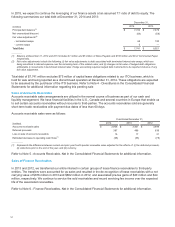
Other Comprehensive (Loss) Income
Other comprehensive loss attributable to Xerox was $1,380 million in 2014 as compared to income of $448 million
in 2013. The decrease of $1,828 million from 2013 is primarily the result of losses of $662 million from changes in
our defined benefit plans in 2014 as compared to gains of $632 million in 2013. The benefit plan losses in 2014 are
primarily due to a decrease in the discount rates used to measure our benefit obligations in 2014 as compared to an
increase in rates in 2013. (Refer to our discussion of Pension Plan Assumptions in the Application of Critical
Accounting Policies section of the MD&A as well as Note 16 - Employee Benefit Plans in the Consolidated Financial
Statements for additional information). The remainder of the year-over-year decrease in other comprehensive
income is related to the $549 million increase in losses from the translation of our foreign currency denominated net
assets as a result of the increased weakening in 2014 of our major foreign currencies as compared to the U.S.
Dollar.
2013 Other comprehensive income attributable to Xerox of $448 million increased $959 million from 2012. The
increase was primarily the result of gains associated with our defined benefit plans due to an increase in the
discount rates used to measure our benefit obligations (Refer to our discussion of Pension Plan Assumptions in the
Application of Critical Accounting Policies section of the MD&A as well as Note 16 - Employee Benefit Plans in the
Consolidated Financial Statements for additional information). These gains were partially offset by losses from the
translation of our foreign currency-denominated net assets in 2013 as compared to translation gains in 2012. The
translation losses are the result of the weakening of our major foreign currencies against the U.S. Dollar in 2013 as
compared to a strengthening of those same currencies in 2012.
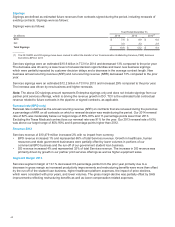
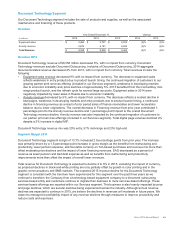
Recent Accounting Pronouncements
Refer to Note 1 - Summary of Significant Accounting Policies in the Consolidated Financial Statements for a description
of recent accounting pronouncements including the respective dates of adoption and the effects on results of operations
and financial conditions.
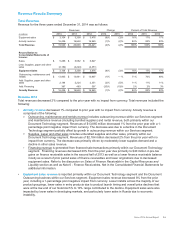
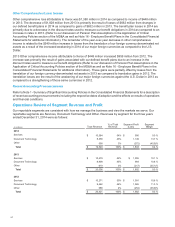
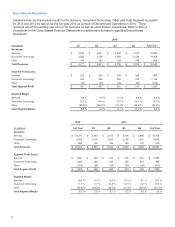
Operations Review of Segment Revenue and Profit
Our reportable segments are consistent with how we manage the business and view the markets we serve. Our
reportable segments are Services, Document Technology and Other. Revenues by segment for the three years
ended December 31, 2014 were as follows:
(in millions) Total Revenue
% of Total
Revenue
Segment Profit
(Loss)
Segment
Margin
2014
Services $10,584 54% $ 956 9.0 %
Document Technology 8,358 43% 1,149 13.7 %
Other 598 3% (272) (45.5)%
Total $19,540 100%$ 1,833 9.4 %
2013
Services $10,479 52% $ 1,055 10.1 %
Document Technology 8,908 45% 964 10.8 %
Other 619 3% (217) (35.1)%
Total $20,006 100%$ 1,802 9.0 %
2012
Services $10,271 50% $ 1,091 10.6 %
Document Technology 9,462 46% 1,065 11.3 %
Other 688 4% (254) (36.9)%
Total $20,421 100%$ 1,902 9.3 %
41