Xerox 2014 Annual Report Download - page 63
Download and view the complete annual report
Please find page 63 of the 2014 Xerox annual report below. You can navigate through the pages in the report by either clicking on the pages listed below, or by using the keyword search tool below to find specific information within the annual report.-
 1
1 -
2
-
3
-
4
-
5
-
6
-
7
-
8
-
9
-
10
-
11
-
12
-
13
-
14
-
15
-
16
-
17
-
18
-
19
-
20
-
21
-
22
-
23
-
24
-
25
-
26
-
27
-
28
-
29
-
30
-
31
-
32
-
33
-
34
-
35
-
36
-
37
-
38
-
39
-
40
-
41
-
42
-
43
-
44
-
45
-
46
-
47
-
48
-
49
-
50
-
51
-
52
-
 53
53 -
 54
54 -
 55
55 -
 56
56 -
 57
57 -
 58
58 -
 59
59 -
 60
60 -
 61
61 -
 62
62 -
 63
63 -
 64
64 -
 65
65 -
 66
66 -
 67
67 -
 68
68 -
 69
69 -
 70
70 -
 71
71 -
 72
72 -
 73
73 -
74
-
75
-
76
-
77
-
78
-
79
-
80
-
81
-
82
-
83
-
84
-
85
-
86
-
87
-
88
-
89
-
90
-
91
-
92
-
93
-
94
-
95
-
96
-
97
-
98
-
99
-
100
-
101
-
102
-
103
-
104
-
105
-
106
-
107
-
108
-
109
-
110
-
111
-
112
-
113
-
114
-
115
-
116
-
117
-
118
-
119
-
120
-
121
-
122
-
123
-
124
-
125
-
126
-
127
-
128
-
129
-
130
-
131
-
132
-
133
-
134
-
135
-
136
-
137
-
138
-
139
-
140
-
141
-
142
-
143
-
144
-
145
-
146
-
147
-
148
-
149
-
150
-
151
-
152
 |
 |

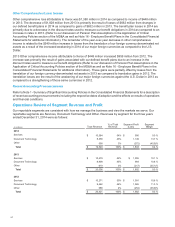
Capital Resources and Liquidity
Our liquidity is primarily dependent on our ability to continue to generate strong cash flows from operations.
Additional liquidity is also provided through access to the financial capital markets, including the Commercial Paper
market, as well as a committed global credit facility. The following is a summary of our liquidity position:
•As of December 31, 2014 and 2013, total cash and cash equivalents were $1,411 million and $1,764 million,
respectively, and there was $150 million and $0 million of borrowings under our Commercial Paper Program,
respectively. There were no borrowings or letters of credit under our $2 billion Credit Facility at either year end.
The decrease in our cash balance in 2014 is primarily due to increased acquisitions and share repurchases.
Refer to the Cash Flow Analysis section below.
• Over the past three years we have consistently delivered strong cash flows from operations driven by the
strength of our annuity-based revenue model. Cash flows from operations was $2,063 million, $2,375 million and
$2,580 million in each of the years in the three year period ended December 31, 2014, respectively. Cash flows
from operations reflect the cash impacts from the sales of finance receivables - refer to Sales of Finance
Receivables within this section.
• We expect cash flows from operations to be between $1.7 and $1.9 billion in 2015, which takes into
consideration approximately $300 million from the adverse impact of prior period sales of finance receivables as
well as the pending sale of our ITO business, which we expect to close in the first half of 2015.
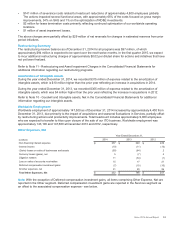
Cash Flow Analysis
The following summarizes our cash flows for the three years ended December 31, 2014, as reported in our
Consolidated Statements of Cash Flows in the accompanying Consolidated Financial Statements:
Year Ended December 31, Change
(in millions) 2014 2013 2012 2014 2013
Net cash provided by operating activities $ 2,063 $2,375 $2,580 $ (312) $ (205)
Net cash used in investing activities (703)(452)(761) (251) 309
Net cash used in financing activities (1,624) (1,402) (1,472) (222) 70
Effect of exchange rate changes on cash and cash equivalents (89)(3)(3)(86)—
(Decrease) increase in cash and cash equivalents (353)518 344 (871) 174
Cash and cash equivalents at beginning of year 1,764 1,246 902 518 344
Cash and Cash Equivalents at End of Year $1,411 $1,764 $1,246 $ (353) $ 518
Cash Flows from Operating Activities
Net cash provided by operating activities was $2,063 million for the year ended December 31, 2014. The $312
million decrease in operating cash from 2013 was primarily due to the following:
•$598 million decrease from finance receivables primarily related to the impact from prior period sales of
receivables partially offset by higher net run-off due to lower lease originations. Refer to Note 6 - Finance
Receivables, Net in the Consolidated Financial Statements for additional information regarding the sale of
finance receivables.
•$54 million decrease due to higher contributions to our defined benefit pension plans.
•$157 million increase due to higher accounts payable and accrued compensation primarily related to the timing
of accounts payable payments and improved payment terms with key suppliers.
•$92 million increase from accounts receivable primarily due to the timing of collections and improved collections
partially offset by the impact from quarterly revenue changes.
•$42 million increase from lower spending for product software and up-front costs for outsourcing service
contracts.
•$34 million increase due to lower net income tax payments primarily due to refunds in 2014 from prior years.
•$20 million increase from lower installs of equipment on operating leases.
Net cash provided by operating activities was $2,375 million for the year ended December 31, 2013. The $205
million decrease in operating cash from 2012 was primarily due to the following:
•$105 million decrease in pre-tax income before net gain on sales of businesses and assets and restructuring.
•$307 million decrease due to lower net run-off of finance receivables of $280 million and higher equipment on
operating leases of $27 million. The lower net run-off of finance receivables was primarily related to the impact
Xerox 2014 Annual Report 48