Xerox 2014 Annual Report Download - page 120
Download and view the complete annual report
Please find page 120 of the 2014 Xerox annual report below. You can navigate through the pages in the report by either clicking on the pages listed below, or by using the keyword search tool below to find specific information within the annual report.-
 1
1 -
2
-
3
-
4
-
5
-
6
-
7
-
8
-
9
-
10
-
11
-
12
-
13
-
14
-
15
-
16
-
17
-
18
-
19
-
20
-
21
-
22
-
23
-
24
-
25
-
26
-
27
-
28
-
29
-
30
-
31
-
32
-
33
-
34
-
35
-
36
-
37
-
38
-
39
-
40
-
41
-
42
-
43
-
44
-
45
-
46
-
47
-
48
-
49
-
50
-
51
-
52
-
53
-
54
-
55
-
56
-
57
-
58
-
59
-
60
-
61
-
62
-
63
-
64
-
65
-
66
-
67
-
68
-
69
-
70
-
71
-
72
-
73
-
74
-
75
-
76
-
77
-
78
-
79
-
80
-
81
-
82
-
83
-
84
-
85
-
86
-
87
-
88
-
89
-
90
-
91
-
92
-
93
-
94
-
95
-
96
-
97
-
98
-
99
-
100
-
101
-
102
-
103
-
104
-
105
-
106
-
107
-
108
-
109
-
 110
110 -
 111
111 -
 112
112 -
 113
113 -
 114
114 -
 115
115 -
 116
116 -
 117
117 -
 118
118 -
 119
119 -
 120
120 -
 121
121 -
 122
122 -
 123
123 -
 124
124 -
 125
125 -
 126
126 -
 127
127 -
 128
128 -
 129
129 -
 130
130 -
131
-
132
-
133
-
134
-
135
-
136
-
137
-
138
-
139
-
140
-
141
-
142
-
143
-
144
-
145
-
146
-
147
-
148
-
149
-
150
-
151
-
152
 |
 |

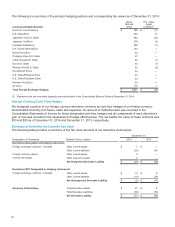
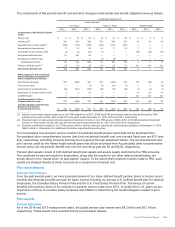
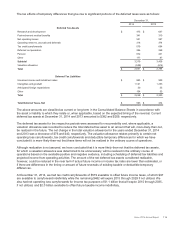
Aggregate information for pension plans with an Accumulated benefit obligation in excess of plan assets is
presented below:
December 31, 2014 December 31, 2013
Projected
benefit
obligation
Accumulated
benefit
obligation
Fair value of
plan assets
Projected
benefit
obligation
Accumulated
benefit
obligation
Fair value of
plan assets
Underfunded Plans:
U.S. $ 4,351 $4,351 $3,126 $3,571 $3,565 $2,876
Non U.S. 6,376 6,125 5,848 5,350 5,104 4,964
Unfunded Plans:
U.S. $ 365 $ 365 $—$
322 $322 $—
Non U.S. 567 551 —540 526 —
Total Underfunded and Unfunded Plans:
U.S. $ 4,716 $4,716 $3,126 $3,893 $3,887 $2,876
Non U.S. 6,943 6,676 5,848 5,890 5,630 4,964
Total $ 11,659 $ 11,392 $8,974 $9,783 $9,517 $7,840
Our pension plan assets and benefit obligations at December 31, 2014 were as follows:
(in billions)
Fair Value of
Pension Plan
Assets
Pension Benefit
Obligations Net Funded Status
U.S. funded $ 3.1 $ 4.4 $ (1.3)
U.S. unfunded —0.3 (0.3)
Total U.S. $ 3.1 $ 4.7 $ (1.6)
U.K. 3.9 4.2 (0.3)
Canada 0.8 0.9 (0.1)
Other funded 1.4 1.6 (0.2)
Other unfunded —0.5 (0.5)
Total $9.2$
11.9 $(2.7)
Prior to the freeze of current benefits (see below), most of our defined benefit pension plans generally provided
employees a benefit, depending on eligibility, calculated under a highest average pay and years of service formula.
Our primary domestic defined benefit pension plans provided a benefit at the greater of (i) the highest average pay
and years of service formula, (ii) the benefit calculated under a formula that provides for the accumulation of salary
and interest credits during an employee's work life or (iii) the individual account balance from the Company's prior
defined contribution plan (Transitional Retirement Account or TRA).
105