Xerox 2014 Annual Report Download - page 50
Download and view the complete annual report
Please find page 50 of the 2014 Xerox annual report below. You can navigate through the pages in the report by either clicking on the pages listed below, or by using the keyword search tool below to find specific information within the annual report.-
 1
1 -
2
-
3
-
4
-
5
-
6
-
7
-
8
-
9
-
10
-
11
-
12
-
13
-
14
-
15
-
16
-
17
-
18
-
19
-
20
-
21
-
22
-
23
-
24
-
25
-
26
-
27
-
28
-
29
-
30
-
31
-
32
-
33
-
34
-
35
-
36
-
37
-
38
-
39
-
 40
40 -
 41
41 -
 42
42 -
 43
43 -
 44
44 -
 45
45 -
 46
46 -
 47
47 -
 48
48 -
 49
49 -
 50
50 -
 51
51 -
 52
52 -
 53
53 -
 54
54 -
 55
55 -
 56
56 -
 57
57 -
 58
58 -
 59
59 -
 60
60 -
61
-
62
-
63
-
64
-
65
-
66
-
67
-
68
-
69
-
70
-
71
-
72
-
73
-
74
-
75
-
76
-
77
-
78
-
79
-
80
-
81
-
82
-
83
-
84
-
85
-
86
-
87
-
88
-
89
-
90
-
91
-
92
-
93
-
94
-
95
-
96
-
97
-
98
-
99
-
100
-
101
-
102
-
103
-
104
-
105
-
106
-
107
-
108
-
109
-
110
-
111
-
112
-
113
-
114
-
115
-
116
-
117
-
118
-
119
-
120
-
121
-
122
-
123
-
124
-
125
-
126
-
127
-
128
-
129
-
130
-
131
-
132
-
133
-
134
-
135
-
136
-
137
-
138
-
139
-
140
-
141
-
142
-
143
-
144
-
145
-
146
-
147
-
148
-
149
-
150
-
151
-
152
 |
 |

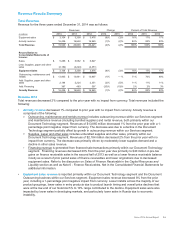
Revenue 2013
Total revenues decreased 2% compared to the prior year and included 1-percentage point positive impact from
currency. Total revenues included the following:
•Annuity revenue decreased 2% compared to prior year with no impact from currency. Annuity revenue is
comprised of the following:
Outsourcing, maintenance and rentals revenue includes outsourcing revenue within our Services segment
and technical service revenue (including bundled supplies) and rental revenue, both primarily within our
Document Technology segment. Revenues of $13,941 million remained flat from the prior year and included
a 1-percentage point positive impact from currency. This was primarily driven by growth in our Services
segment offset by a decline in maintenance revenue due to moderately lower page volumes and revenue
per page.
Supplies, paper and other sales includes unbundled supplies and other sales, primarily within our
Document Technology segment. Revenues of $2,224 million decreased 5% from the prior year with no
impact from currency. The decrease was primarily driven by a reduction in channel supplies inventories in
the U.S. and developing markets, moderately lower supplies and paper demand, and lower licensing sales.
Financing revenue is generated from financed sale transactions primarily within our Document Technology
segment. Financing revenues decreased 19% from the prior year reflecting a lower balance of finance
receivables as a result of prior period sales of receivables and lower originations due to decreased
equipment sales. Financing revenues in 2013 include gains of $40 million from the sales of finance
receivables as compared to $44 million in 2012. Refer to the discussion on Sales of Finance Receivable in
the Capital Resources and Liquidity section as well as Note 6 - Finance Receivables, Net in the
Consolidated Financial Statements for additional information.
•Equipment sales revenue is reported primarily within our Document Technology segment and the Document
Outsourcing business within our Services segment. Equipment sales revenue decreased 3% from the prior
year, including a 1-percentage point positive impact from currency. Benefits from new product introductions and
a positive mix impact were more than offset by lower sales in developing markets and price declines ranging
from 5% to 10%, which is consistent with prior years.
An analysis of the change in revenue for each business segment is included in the “Operations Review of Segment
Revenue and Profit” section.
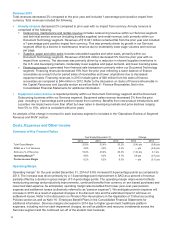
Costs, Expenses and Other Income
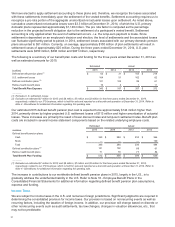
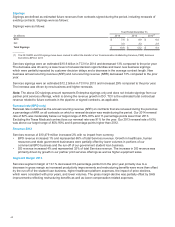
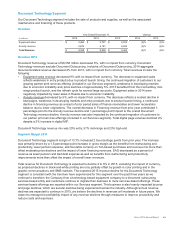
Summary of Key Financial Ratios
Year Ended December 31, Change
2014 2013 2012 2014 2013
Total Gross Margin 32.0%32.4%33.2%(0.4) pts (0.8) pts
RD&E as a % of Revenue 3.0% 3.0% 3.2% — pts (0.2) pts
SAG as a % of Revenue 19.4%20.4%20.3%(1.0) pts 0.1 pts
Operating Margin(1) 9.6% 9.0% 9.7% 0.6 pts (0.7) pts
Pre-tax Income Margin 6.2% 6.2% 6.3% — pts (0.1) pts
Operating Margin
Operating margin1for the year ended December 31, 2014 of 9.6% increased 0.6-percentage points as compared to
2013. The increase was driven primarily by a 1.0-percentage point improvement in SAG as a percent of revenue
partially offset by a decline in gross margin of 0.4-percentage points. The operating margin improvement reflects
restructuring savings and productivity improvements, continued benefits from currency on yen based purchases and
lower bad debt expense. As anticipated, operating margin also benefited from lower year-over-year pension
expense and settlement losses (collectively referred to as "pension expense"). We anticipate pension expense will
increase in 2015 as a result of expected changes in the discount rate and the estimated impact it will have on
settlement losses. Refer to the discussion on Pension Plan Assumptions in the Application of Critical accounting
Policies section as well as Note 16 - Employee Benefit Plans in the Consolidated Financial Statements for
additional information. Services margins decreased in 2014 due to higher government healthcare platform
expenses, including net non-cash impairment charges, as well as platform and resource investments across the
Services segment and the continued run-off of the student loan business.
35