Xerox 2014 Annual Report Download - page 100
Download and view the complete annual report
Please find page 100 of the 2014 Xerox annual report below. You can navigate through the pages in the report by either clicking on the pages listed below, or by using the keyword search tool below to find specific information within the annual report.-
 1
1 -
2
-
3
-
4
-
5
-
6
-
7
-
8
-
9
-
10
-
11
-
12
-
13
-
14
-
15
-
16
-
17
-
18
-
19
-
20
-
21
-
22
-
23
-
24
-
25
-
26
-
27
-
28
-
29
-
30
-
31
-
32
-
33
-
34
-
35
-
36
-
37
-
38
-
39
-
40
-
41
-
42
-
43
-
44
-
45
-
46
-
47
-
48
-
49
-
50
-
51
-
52
-
53
-
54
-
55
-
56
-
57
-
58
-
59
-
60
-
61
-
62
-
63
-
64
-
65
-
66
-
67
-
68
-
69
-
70
-
71
-
72
-
73
-
74
-
75
-
76
-
77
-
78
-
79
-
80
-
81
-
82
-
83
-
84
-
85
-
86
-
87
-
88
-
89
-
 90
90 -
 91
91 -
 92
92 -
 93
93 -
 94
94 -
 95
95 -
 96
96 -
 97
97 -
 98
98 -
 99
99 -
 100
100 -
 101
101 -
 102
102 -
 103
103 -
 104
104 -
 105
105 -
 106
106 -
 107
107 -
 108
108 -
 109
109 -
 110
110 -
111
-
112
-
113
-
114
-
115
-
116
-
117
-
118
-
119
-
120
-
121
-
122
-
123
-
124
-
125
-
126
-
127
-
128
-
129
-
130
-
131
-
132
-
133
-
134
-
135
-
136
-
137
-
138
-
139
-
140
-
141
-
142
-
143
-
144
-
145
-
146
-
147
-
148
-
149
-
150
-
151
-
152
 |
 |

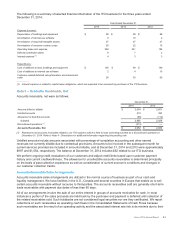
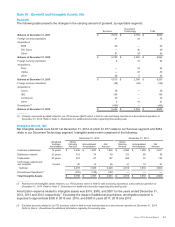
Since our allowance for doubtful finance receivables is determined by country, the risk characteristics in our
finance receivable portfolio segments will generally be consistent with the risk factors associated with the
economies of those countries/regions. Loss rates declined in the U.S. reflecting the effects of improved collections
during 2014 and 2013 as well as the lower balance of finance receivables primarily due to sales in 2013 and 2012.
Since Europe is comprised of various countries and regional economies, the risk profile within our European
portfolio segment is somewhat more diversified due to the varying economic conditions among and within the
countries. Charge-offs in Europe were $29 in 2014 as compared to $60 in the prior year, reflecting a significant
improvement from the credit issues that began back in 2011. Loss rates peaked in 2011 as a result of the
European economic challenges particularly for countries in the southern region.
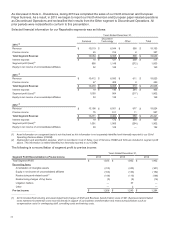
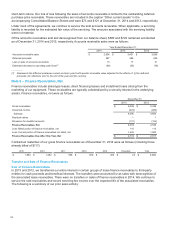
The following table is a rollforward of the allowance for doubtful finance receivables as well as the related investment
in finance receivables:
Allowance for Credit Losses: United States Canada Europe Other(3) Total
Balance at December 31, 2012 $50$31$85$ 4$170
Provision 13 11 53 481
Charge-offs (8) (16)(60)(2)
(86)
Recoveries and other(1) 213—6
Sale of finance receivables (12)(5)— —
(17)
Balance at December 31, 2013 45 22 81 6 154
Provision — 9 15 933
Charge-offs (5) (14)(29)(3)
(51)
Recoveries and other(1) 1 3 (9) — (5)
Balance at December 31, 2014 $41$20$58$12$
131
Finance Receivables Collectively Evaluated for
Impairment:
December 31, 2013(2) $1,666 $421 $2,292 $304 $4,683
December 31, 2014(2) $1,728 $424 $1,835 $398 $4,385
__________
(1) Includes the impacts of foreign currency translation and adjustments to reserves necessary to reflect events of non-payment such as
customer accommodations and contract terminations.
(2) Total Finance receivables exclude residual values of $0 and $1 and the allowance for credit losses of $131 and $154 at December 31,
2014 and 2013, respectively.
(3) Includes developing market countries and smaller units.
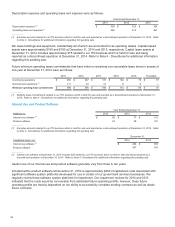
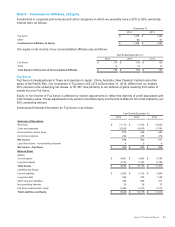
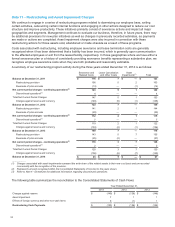
In the U.S. and Canada, customers are further evaluated or segregated by class based on industry sector. The
primary customer classes are Finance & Other Services, Government & Education; Graphic Arts; Industrial;
Healthcare and Other. In Europe, customers are further grouped by class based on the country or region of the
customer. The primary customer classes include the U.K./Ireland, France and the following European regions -
Central, Nordic and Southern. These groupings or classes are used to understand the nature and extent of our
exposure to credit risk arising from finance receivables.
We evaluate our customers based on the following credit quality indicators:
•Investment grade: This rating includes accounts with excellent to good business credit, asset quality and the
capacity to meet financial obligations. These customers are less susceptible to adverse effects due to shifts in
economic conditions or changes in circumstance. The rating generally equates to a Standard & Poors (S&P)
rating of BBB- or better. Loss rates in this category are normally minimal at less than 1%.
•Non-investment grade: This rating includes accounts with average credit risk that are more susceptible to
loss in the event of adverse business or economic conditions. This rating generally equates to a BB S&P
rating. Although we experience higher loss rates associated with this customer class, we believe the risk is
somewhat mitigated by
the fact that our leases are fairly well dispersed across a large and diverse customer base. In addition, the
higher loss rates are largely offset by the higher rates of return we obtain with such leases. Loss rates in this
category are generally in the range of 2% to 4%.
•Substandard: This rating includes accounts that have marginal credit risk such that the customer’s ability to
make repayment is impaired or may likely become impaired. We use numerous strategies to mitigate risk
including higher rates of interest, prepayments, personal guarantees, etc. Accounts in this category include
customers who were downgraded during the term of the lease from investment and non-investment grade
85