Xerox 2014 Annual Report Download - page 66
Download and view the complete annual report
Please find page 66 of the 2014 Xerox annual report below. You can navigate through the pages in the report by either clicking on the pages listed below, or by using the keyword search tool below to find specific information within the annual report.-
 1
1 -
2
-
3
-
4
-
5
-
6
-
7
-
8
-
9
-
10
-
11
-
12
-
13
-
14
-
15
-
16
-
17
-
18
-
19
-
20
-
21
-
22
-
23
-
24
-
25
-
26
-
27
-
28
-
29
-
30
-
31
-
32
-
33
-
34
-
35
-
36
-
37
-
38
-
39
-
40
-
41
-
42
-
43
-
44
-
45
-
46
-
47
-
48
-
49
-
50
-
51
-
52
-
53
-
54
-
55
-
 56
56 -
 57
57 -
 58
58 -
 59
59 -
 60
60 -
 61
61 -
 62
62 -
 63
63 -
 64
64 -
 65
65 -
 66
66 -
 67
67 -
 68
68 -
 69
69 -
 70
70 -
 71
71 -
 72
72 -
 73
73 -
 74
74 -
 75
75 -
 76
76 -
77
-
78
-
79
-
80
-
81
-
82
-
83
-
84
-
85
-
86
-
87
-
88
-
89
-
90
-
91
-
92
-
93
-
94
-
95
-
96
-
97
-
98
-
99
-
100
-
101
-
102
-
103
-
104
-
105
-
106
-
107
-
108
-
109
-
110
-
111
-
112
-
113
-
114
-
115
-
116
-
117
-
118
-
119
-
120
-
121
-
122
-
123
-
124
-
125
-
126
-
127
-
128
-
129
-
130
-
131
-
132
-
133
-
134
-
135
-
136
-
137
-
138
-
139
-
140
-
141
-
142
-
143
-
144
-
145
-
146
-
147
-
148
-
149
-
150
-
151
-
152
 |
 |

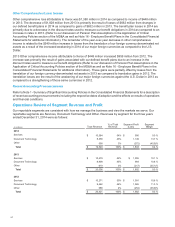
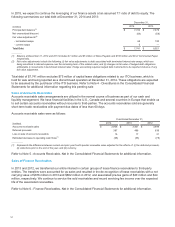
In 2015, we expect to continue the leveraging of our finance assets at an assumed 7:1 ratio of debt to equity. The
following summarizes our total debt at December 31, 2014 and 2013:
December 31,
(in millions) 2014 2013
Principal debt balance(1) $7,722 $7,979
Net unamortized discount (54)(58)
Fair value adjustments(2)
- terminated swaps 68 100
- current swaps 5—
Total Debt $7,741 $8,021
_________
(1) Balance at December 31, 2014 and 2013 includes $1 million and $5 million of Notes Payable and $150 million and $0 of Commercial Paper,
respectively.
(2) Fair value adjustments include the following: (i) fair value adjustments to debt associated with terminated interest rate swaps, which are
being amortized to interest expense over the remaining term of the related notes; and (ii) changes in fair value of hedged debt obligations
attributable to movements in benchmark interest rates. Hedge accounting requires hedged debt instruments to be reported inclusive of any
fair value adjustment.
Total debt of $7,741 million excludes $75 million of capital lease obligations related to our ITO business, which is
held for sale and being reported as a discontinued operation at December 31, 2014. These obligations are expected
to be assumed by the purchaser of the ITO business. Refer to Note 4 - Divestitures in the Consolidated Financial
Statements for additional information regarding this pending sale
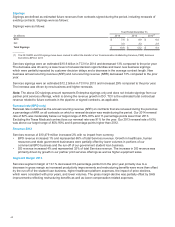
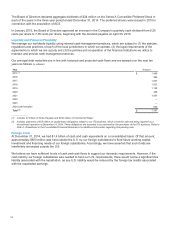
Sales of Accounts Receivable
Accounts receivable sales arrangements are utilized in the normal course of business as part of our cash and
liquidity management. We have financial facilities in the U.S., Canada and several countries in Europe that enable us
to sell certain accounts receivables without recourse to third-parties. The accounts receivables sold are generally
short-term trade receivables with payment due dates of less than 60 days.
Accounts receivable sales were as follows:
Year Ended December 31,
(in millions) 2014 2013 2012
Accounts receivable sales $2,906 $3,401 $3,699
Deferred proceeds 387 486 639
Loss on sale of accounts receivable 15 17 21
Estimated decrease to operating cash flows(1) (68)(55)(78)
__________
(1) Represents the difference between current and prior year fourth quarter receivable sales adjusted for the effects of: (i) the deferred proceeds,
(ii) collections prior to the end of the year, and (iii) currency.
Refer to Note 5 - Accounts Receivable, Net in the Consolidated Financial Statements for additional information.
Sales of Finance Receivables
In 2013 and 2012, we transferred our entire interest in certain groups of lease finance receivables to third-party
entities. The transfers were accounted for as sales and resulted in the de-recognition of lease receivables with a net
carrying value of $676 million in 2013 and $682 million in 2012, and associated pre-tax gains of $40 million and $44
million, respectively. We continue to service the sold receivables and record servicing fee income over the expected
life of the associated receivables.
Refer to Note 6 - Finance Receivables, Net in the Consolidated Financial Statements for additional information.
51