Xerox 2014 Annual Report Download - page 68
Download and view the complete annual report
Please find page 68 of the 2014 Xerox annual report below. You can navigate through the pages in the report by either clicking on the pages listed below, or by using the keyword search tool below to find specific information within the annual report.-
 1
1 -
2
-
3
-
4
-
5
-
6
-
7
-
8
-
9
-
10
-
11
-
12
-
13
-
14
-
15
-
16
-
17
-
18
-
19
-
20
-
21
-
22
-
23
-
24
-
25
-
26
-
27
-
28
-
29
-
30
-
31
-
32
-
33
-
34
-
35
-
36
-
37
-
38
-
39
-
40
-
41
-
42
-
43
-
44
-
45
-
46
-
47
-
48
-
49
-
50
-
51
-
52
-
53
-
54
-
55
-
56
-
57
-
 58
58 -
 59
59 -
 60
60 -
 61
61 -
 62
62 -
 63
63 -
 64
64 -
 65
65 -
 66
66 -
 67
67 -
 68
68 -
 69
69 -
 70
70 -
 71
71 -
 72
72 -
 73
73 -
 74
74 -
 75
75 -
 76
76 -
 77
77 -
 78
78 -
79
-
80
-
81
-
82
-
83
-
84
-
85
-
86
-
87
-
88
-
89
-
90
-
91
-
92
-
93
-
94
-
95
-
96
-
97
-
98
-
99
-
100
-
101
-
102
-
103
-
104
-
105
-
106
-
107
-
108
-
109
-
110
-
111
-
112
-
113
-
114
-
115
-
116
-
117
-
118
-
119
-
120
-
121
-
122
-
123
-
124
-
125
-
126
-
127
-
128
-
129
-
130
-
131
-
132
-
133
-
134
-
135
-
136
-
137
-
138
-
139
-
140
-
141
-
142
-
143
-
144
-
145
-
146
-
147
-
148
-
149
-
150
-
151
-
152
 |
 |

The Board of Directors declared aggregate dividends of $24 million on the Series A Convertible Preferred Stock in
each of the years in the three year period ended December 31, 2014. The preferred shares were issued in 2010 in
connection with the acquisition of ACS.
In January 2015, the Board of Directors approved an increase in the Company's quarterly cash dividend from 6.25
cents per share to 7.00 cents per share, beginning with the dividend payable on April 30, 2015.
Liquidity and Financial Flexibility
We manage our worldwide liquidity using internal cash management practices, which are subject to (1) the statutes,
regulations and practices of each of the local jurisdictions in which we operate, (2) the legal requirements of the
agreements to which we are a party and (3) the policies and cooperation of the financial institutions we utilize to
maintain and provide cash management services.
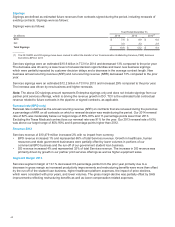
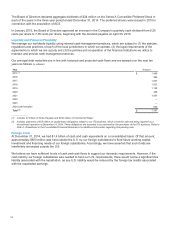
Our principal debt maturities are in line with historical and projected cash flows and are spread over the next ten
years as follows (in millions):
Year Amount
2015 (1) $1,458
2016 998
2017 1,037
2018 1,023
2019 1,158
2020 406
2021 1,067
2022 —
2023 —
2024 and thereafter 650
Total (2) $7,797
______________
(1) Includes $1 million of Notes Payable and $150 million of Commercial Paper.
(2) Includes payments of $75 million on capital lease obligations related to our ITO business, which is held for sale and being reported as a
discontinued operation at December 31, 2014. These obligations are expected to be assumed by the purchaser of the ITO business. Refer to
Note 4 - Divestitures in the Consolidated Financial Statements for additional information regarding this pending sale.
Foreign Cash
At December 31, 2014, we had $1.4 billion of cash and cash equivalents on a consolidated basis. Of that amount,
approximately $600 million was held outside the U.S. by our foreign subsidiaries to fund future working capital,
investment and financing needs of our foreign subsidiaries. Accordingly, we have asserted that such funds are
indefinitely reinvested outside the U.S.
We believe we have sufficient levels of cash and cash flows to support our domestic requirements. However, if the
cash held by our foreign subsidiaries was needed to fund our U.S. requirements, there would not be a significant tax
liability associated with the repatriation, as any U.S. liability would be reduced by the foreign tax credits associated
with the repatriated earnings.
53