Xerox 2014 Annual Report Download - page 136
Download and view the complete annual report
Please find page 136 of the 2014 Xerox annual report below. You can navigate through the pages in the report by either clicking on the pages listed below, or by using the keyword search tool below to find specific information within the annual report.-
 1
1 -
2
-
3
-
4
-
5
-
6
-
7
-
8
-
9
-
10
-
11
-
12
-
13
-
14
-
15
-
16
-
17
-
18
-
19
-
20
-
21
-
22
-
23
-
24
-
25
-
26
-
27
-
28
-
29
-
30
-
31
-
32
-
33
-
34
-
35
-
36
-
37
-
38
-
39
-
40
-
41
-
42
-
43
-
44
-
45
-
46
-
47
-
48
-
49
-
50
-
51
-
52
-
53
-
54
-
55
-
56
-
57
-
58
-
59
-
60
-
61
-
62
-
63
-
64
-
65
-
66
-
67
-
68
-
69
-
70
-
71
-
72
-
73
-
74
-
75
-
76
-
77
-
78
-
79
-
80
-
81
-
82
-
83
-
84
-
85
-
86
-
87
-
88
-
89
-
90
-
91
-
92
-
93
-
94
-
95
-
96
-
97
-
98
-
99
-
100
-
101
-
102
-
103
-
104
-
105
-
106
-
107
-
108
-
109
-
110
-
111
-
112
-
113
-
114
-
115
-
116
-
117
-
118
-
119
-
120
-
121
-
122
-
123
-
124
-
125
-
 126
126 -
 127
127 -
 128
128 -
 129
129 -
 130
130 -
 131
131 -
 132
132 -
 133
133 -
 134
134 -
 135
135 -
 136
136 -
 137
137 -
 138
138 -
 139
139 -
 140
140 -
 141
141 -
 142
142 -
 143
143 -
 144
144 -
 145
145 -
 146
146 -
147
-
148
-
149
-
150
-
151
-
152
 |
 |

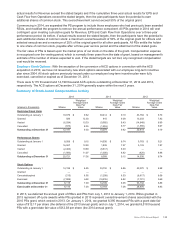
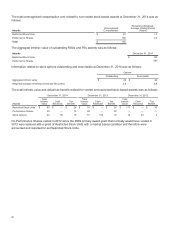
The total unrecognized compensation cost related to non-vested stock-based awards at December 31, 2014 was as
follows:
Awards
Unrecognized
Compensation
Remaining Weighted-
Average Vesting Period
(Years)
Restricted Stock Units $ 23 1.2
Performance Shares 109 2.2
Total $132
The aggregate intrinsic value of outstanding RSUs and PSs awards was as follows:
Awards December 31, 2014
Restricted Stock Units $ 169
Performance Shares 287
Information related to stock options outstanding and exercisable at December 31, 2014 was as follows:
Options
Outstanding Exercisable
Aggregate intrinsic value $ 42 $ 42
Weighted-average remaining contractual life (years) 2.8 2.8
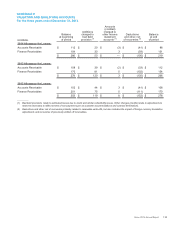
The total intrinsic value and actual tax benefit realized for vested and exercised stock-based awards was as follows:
December 31, 2014 December 31, 2013 December 31, 2012
Awards
Total
Intrinsic
Value
Cash
Received
Tax
Benefit
Total
Intrinsic
Value
Cash
Received
Tax
Benefit
Total
Intrinsic
Value
Cash
Received
Tax
Benefit
Restricted Stock Units $ 85 $ — $ 26 $91$—$30$
117 $—$33
Performance Shares 30 — 10 62—22———
Stock Options 42 55 15 51 124 19 12 44 4
No Performance Shares vested in 2012 since the 2009 primary award grant that normally would have vested in
2012 was replaced with a grant of Restricted Stock Units with a market based condition and therefore were
accounted and reported for as Restricted Stock Units.
121