Xerox 2014 Annual Report Download - page 116
Download and view the complete annual report
Please find page 116 of the 2014 Xerox annual report below. You can navigate through the pages in the report by either clicking on the pages listed below, or by using the keyword search tool below to find specific information within the annual report.-
 1
1 -
2
-
3
-
4
-
5
-
6
-
7
-
8
-
9
-
10
-
11
-
12
-
13
-
14
-
15
-
16
-
17
-
18
-
19
-
20
-
21
-
22
-
23
-
24
-
25
-
26
-
27
-
28
-
29
-
30
-
31
-
32
-
33
-
34
-
35
-
36
-
37
-
38
-
39
-
40
-
41
-
42
-
43
-
44
-
45
-
46
-
47
-
48
-
49
-
50
-
51
-
52
-
53
-
54
-
55
-
56
-
57
-
58
-
59
-
60
-
61
-
62
-
63
-
64
-
65
-
66
-
67
-
68
-
69
-
70
-
71
-
72
-
73
-
74
-
75
-
76
-
77
-
78
-
79
-
80
-
81
-
82
-
83
-
84
-
85
-
86
-
87
-
88
-
89
-
90
-
91
-
92
-
93
-
94
-
95
-
96
-
97
-
98
-
99
-
100
-
101
-
102
-
103
-
104
-
105
-
 106
106 -
 107
107 -
 108
108 -
 109
109 -
 110
110 -
 111
111 -
 112
112 -
 113
113 -
 114
114 -
 115
115 -
 116
116 -
 117
117 -
 118
118 -
 119
119 -
 120
120 -
 121
121 -
 122
122 -
 123
123 -
 124
124 -
 125
125 -
 126
126 -
127
-
128
-
129
-
130
-
131
-
132
-
133
-
134
-
135
-
136
-
137
-
138
-
139
-
140
-
141
-
142
-
143
-
144
-
145
-
146
-
147
-
148
-
149
-
150
-
151
-
152
 |
 |
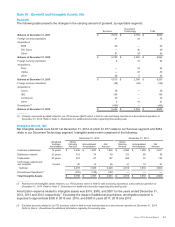
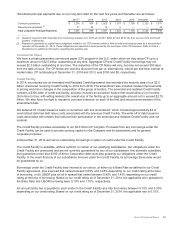
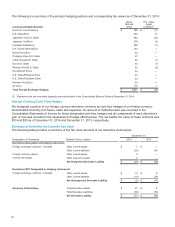
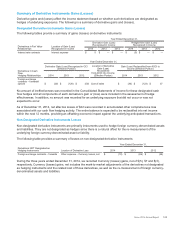
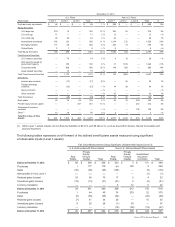
The following is a summary of the primary hedging positions and corresponding fair values as of December 31, 2014:
Currencies Hedged (Buy/Sell)
Gross
Notional
Value
Fair Value
Asset
(Liability)(1)
Euro/U.K. Pound Sterling $785 $(11)
U.S. Dollar/Euro 450 15
Japanese Yen/U.S. Dollar 442 (33)
Japanese Yen/Euro 338 (4)
Canadian Dollar/Euro 299 (1)
U.K. Pound Sterling/Euro 153 1
Swiss Franc/Euro 83 —
Philippine Peso/U.S. Dollar 67 —
Indian Rupee/U.S. Dollar 62 (1)
Euro/U.S. Dollar 53 (1)
Mexican Peso/U.S. Dollar 52 (2)
Euro/Danish Krone 24 —
U.S. Dollar/Philippine Peso 23 —
U.S. Dollar/Canadian Dollar 23 —
Mexican Peso/Euro 22 —
All Other 115 1
Total Foreign Exchange Hedging $2,991 $(36)
____________
(1) Represents the net receivable (payable) amount included in the Consolidated Balance Sheet at December 31, 2014.
Foreign Currency Cash Flow Hedges
We designate a portion of our foreign currency derivative contracts as cash flow hedges of our foreign currency-
denominated inventory purchases, sales and expenses. No amount of ineffectiveness was recorded in the
Consolidated Statements of Income for these designated cash flow hedges and all components of each derivative’s
gain or loss was included in the assessment of hedge effectiveness. The net liability fair value of these contracts was
$30 and $50 as of December 31, 2014 and December 31, 2013, respectively.
Summary of Derivative Instruments Fair Value
The following table provides a summary of the fair value amounts of our derivative instruments:
December 31,
Designation of Derivatives Balance Sheet Location 2014 2013
Derivatives Designated as Hedging Instruments
Foreign exchange contracts – forwards Other current assets $ 7$1
Other current liabilities (39)(51)
Foreign currency options Other current assets 2—
Interest rate swaps Other long-term assets 5—
Net Designated Derivative Liability $(25)$ (50)
Derivatives NOT Designated as Hedging Instruments
Foreign exchange contracts – forwards Other current assets $ 13 $ 5
Other current liabilities (19)(19)
Net Undesignated Derivative Liability $(6)$
(14)
Summary of Derivatives Total Derivative Assets $ 27 $ 6
Total Derivative Liabilities (58)(70)
Net Derivative Liability $(31)$ (64)
101