Xerox 2014 Annual Report Download - page 121
Download and view the complete annual report
Please find page 121 of the 2014 Xerox annual report below. You can navigate through the pages in the report by either clicking on the pages listed below, or by using the keyword search tool below to find specific information within the annual report.-
 1
1 -
2
-
3
-
4
-
5
-
6
-
7
-
8
-
9
-
10
-
11
-
12
-
13
-
14
-
15
-
16
-
17
-
18
-
19
-
20
-
21
-
22
-
23
-
24
-
25
-
26
-
27
-
28
-
29
-
30
-
31
-
32
-
33
-
34
-
35
-
36
-
37
-
38
-
39
-
40
-
41
-
42
-
43
-
44
-
45
-
46
-
47
-
48
-
49
-
50
-
51
-
52
-
53
-
54
-
55
-
56
-
57
-
58
-
59
-
60
-
61
-
62
-
63
-
64
-
65
-
66
-
67
-
68
-
69
-
70
-
71
-
72
-
73
-
74
-
75
-
76
-
77
-
78
-
79
-
80
-
81
-
82
-
83
-
84
-
85
-
86
-
87
-
88
-
89
-
90
-
91
-
92
-
93
-
94
-
95
-
96
-
97
-
98
-
99
-
100
-
101
-
102
-
103
-
104
-
105
-
106
-
107
-
108
-
109
-
110
-
 111
111 -
 112
112 -
 113
113 -
 114
114 -
 115
115 -
 116
116 -
 117
117 -
 118
118 -
 119
119 -
 120
120 -
 121
121 -
 122
122 -
 123
123 -
 124
124 -
 125
125 -
 126
126 -
 127
127 -
 128
128 -
 129
129 -
 130
130 -
 131
131 -
132
-
133
-
134
-
135
-
136
-
137
-
138
-
139
-
140
-
141
-
142
-
143
-
144
-
145
-
146
-
147
-
148
-
149
-
150
-
151
-
152
 |
 |

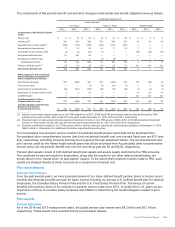
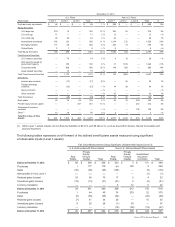
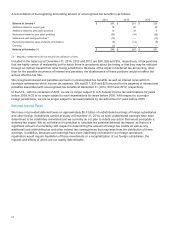
The components of Net periodic benefit cost and other changes in plan assets and benefit obligations were as follows:
Year Ended December 31,
Pension Benefits
U.S. Plans Non-U.S. Plans Retiree Health
2014 2013 2012 2014 2013 2012 2014 2013 2012
Components of Net Periodic Benefit
Costs:
Service cost $ 9 $ 10 $ 112 $ 34 $ 91 $ 83 $ 9 $ 9 $ 9
Interest cost(1) 281 154 282 272 260 270 36 33 42
Expected return on plan assets(2) (290) (179) (306) (342) (317) (307) — — —
Recognized net actuarial loss 17 19 53 54 77 53 1 2 1
Amortization of prior service credit (2) (2) (23) (1) — — (43) (43) (41)
Recognized settlement loss 51 162 82 — — 1 — — —
Recognized curtailment gain — — — (1) (8) ————
Defined Benefit Plans 66 164 200 16 103 100 3 1 11
Defined contribution plans (3) 58 64 28 44 25 33 n/a n/a n/a
Net Periodic Benefit Cost 124 228 228 60 128 133 3 1 11
Other changes in plan assets and
benefit obligations recognized in
Other Comprehensive Income:
Net actuarial loss (gain) 697 (403) 427 481 (224) 416 119 (88) 18
Prior service credit — — (2) (6) (14) (1) — — (6)
Amortization of net actuarial loss (68) (181) (135) (54) (77) (54) (1) (2) (1)
Amortization of net prior service credit 2 2 23 1 — — 43 43 41
Curtailment gain — — — 2 — — n/a n/a n/a
Total Recognized in Other
Comprehensive Income 631 (582) 313 424 (315) 361 161 (47) 52
Total Recognized in Net Periodic
Benefit Cost and Other
Comprehensive Income $ 755 $ (354) $ 541 $ 484 $ (187) $ 494 $ 164 $ (46) $ 63
_______________
(1) Interest cost includes interest expense on non-TRA obligations of $371, $349 and $382 and interest expense directly allocated to TRA
participant accounts of $182, $65 and $170 for the years ended December 31, 2014, 2013 and 2012, respectively.
(2) Expected return on plan assets includes expected investment income on non-TRA assets of $450, $431 and $443 and actual investment
income on TRA assets of $182, $65 and $170 for the years ended December 31, 2014, 2013 and 2012, respectively.
(3) Excludes contributions related to our ITO business, which is held for sale and reported as a discontinued operation at December 31, 2014.
Refer to Note 4 - Divestitures for additional information regarding this pending sale.
The net actuarial loss and prior service credit for the defined benefit pension plans that will be amortized from
Accumulated other comprehensive income (loss) into net periodic benefit cost over the next fiscal year are $111 and
$(4), respectively, excluding amounts that may be recognized through settlement losses. The net actuarial loss and
prior service credit for the retiree health benefit plans that will be amortized from Accumulated other comprehensive
income (loss) into net periodic benefit cost over the next fiscal year are $5 and $(30), respectively.
Pension plan assets consist of both defined benefit plan assets and assets legally restricted to the TRA accounts.
The combined investment results for these plans, along with the results for our other defined benefit plans, are
shown above in the “actual return on plan assets” caption. To the extent that investment results relate to TRA, such
results are charged directly to these accounts as a component of interest cost.
Plan Amendments
Pension Plan Freezes
Over the past several years, we have amended several of our major defined benefit pension plans to freeze current
benefits and eliminate benefits accruals for future service including our primary U.S. defined benefit plan for salaried
employees, the Canadian Salary Pension Plan and the U.K. Final Salary Pension Plan. The freeze of current
benefits is the primary driver of the reduction in pension service costs since 2012. In certain Non-U.S. plans we are
required to continue to consider salary increases and inflation in determining the benefit obligation related to prior
service.
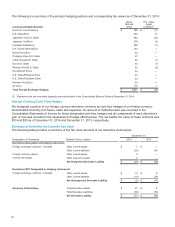
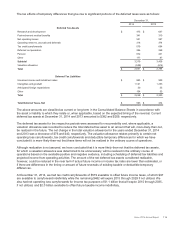
Plan Assets
Current Allocation
As of the 2014 and 2013 measurement dates, the global pension plan assets were $9.2 billion and $8.7 billion,
respectively. These assets were invested among several asset classes.
Xerox 2014 Annual Report 106