Xerox 2014 Annual Report Download - page 52
Download and view the complete annual report
Please find page 52 of the 2014 Xerox annual report below. You can navigate through the pages in the report by either clicking on the pages listed below, or by using the keyword search tool below to find specific information within the annual report.-
 1
1 -
2
-
3
-
4
-
5
-
6
-
7
-
8
-
9
-
10
-
11
-
12
-
13
-
14
-
15
-
16
-
17
-
18
-
19
-
20
-
21
-
22
-
23
-
24
-
25
-
26
-
27
-
28
-
29
-
30
-
31
-
32
-
33
-
34
-
35
-
36
-
37
-
38
-
39
-
40
-
41
-
 42
42 -
 43
43 -
 44
44 -
 45
45 -
 46
46 -
 47
47 -
 48
48 -
 49
49 -
 50
50 -
 51
51 -
 52
52 -
 53
53 -
 54
54 -
 55
55 -
 56
56 -
 57
57 -
 58
58 -
 59
59 -
 60
60 -
 61
61 -
 62
62 -
63
-
64
-
65
-
66
-
67
-
68
-
69
-
70
-
71
-
72
-
73
-
74
-
75
-
76
-
77
-
78
-
79
-
80
-
81
-
82
-
83
-
84
-
85
-
86
-
87
-
88
-
89
-
90
-
91
-
92
-
93
-
94
-
95
-
96
-
97
-
98
-
99
-
100
-
101
-
102
-
103
-
104
-
105
-
106
-
107
-
108
-
109
-
110
-
111
-
112
-
113
-
114
-
115
-
116
-
117
-
118
-
119
-
120
-
121
-
122
-
123
-
124
-
125
-
126
-
127
-
128
-
129
-
130
-
131
-
132
-
133
-
134
-
135
-
136
-
137
-
138
-
139
-
140
-
141
-
142
-
143
-
144
-
145
-
146
-
147
-
148
-
149
-
150
-
151
-
152
 |
 |
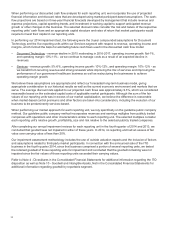
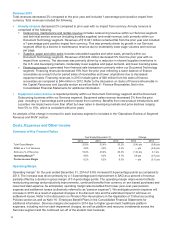
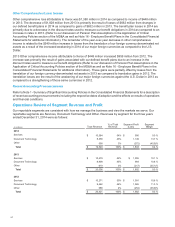
Innovation is one of our core strengths and we continue to invest at levels that enhance this core strength,
particularly in services, color and software. During 2014 we managed our investments in R&D to align with growth
opportunities in areas like business services, color printing and customized communication. Our R&D is also
strategically coordinated with Fuji Xerox.
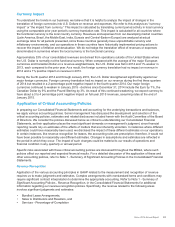
RD&E as a percent of revenue for the year ended December 31, 2013 of 3.0% decreased 0.2-percentage points.
The decrease was driven by the higher mix of Services revenue (which historically has a lower RD&E as a
percentage of revenue) lower spending and productivity improvements.
RD&E of $603 million for the year ended December 31, 2013, was $52 million lower, reflecting the impact of
restructuring and productivity improvements.
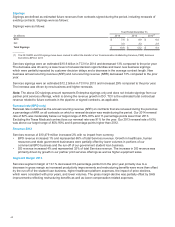
Selling, Administrative and General Expenses (SAG)
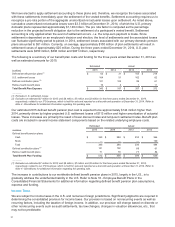
SAG as a percent of revenue of 19.4% decreased 1.0-percentage point for the year ended December 31, 2014. The
decrease was driven by the higher mix of Services revenue (which historically has lower SAG as a percentage of
revenue), restructuring and productivity improvements, and lower pension and bad debt expense. The net reduction
in SAG spending exceeded the overall revenue decline on a percentage basis.
SAG expenses of $3,788 million for the year ended December 31, 2014 were $285 million lower than the prior year
period. The decrease in SAG expense reflects the following:
• $125 million decrease in selling expenses.
• $93 million decrease in general and administrative expenses.
• $67 million decrease in bad debt expenses to $53 million, reflecting the favorable trend in write-offs and
recoveries experienced throughout the year. Full year 2014 bad debt expense remained less than one percent
of receivables.
SAG as a percent of revenue of 20.4% increased 0.1-percentage points for the year ended December 31, 2013.
SAG expenses of $4,073 million for the year ended December 31, 2013 was $68 million lower than the prior year
period. The SAG expense decrease reflects the following:
• $52 million decrease in selling expenses reflecting the benefits from restructuring and productivity
improvements, as well as lower compensation-related expenses and advertising spending partially offset by the
impact of acquisitions.
• $17 million decrease in general and administrative expenses as restructuring savings and productivity
improvements were partially offset by the impact of acquisitions and increased consulting costs.
• $1 million increase in bad debt expense to $120 million.
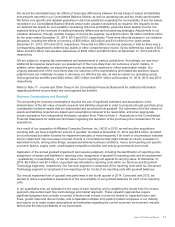
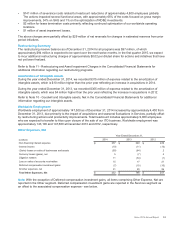
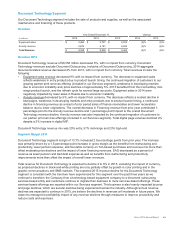
Restructuring and Asset Impairment Charges
During the year ended December 31, 2014, we recorded net restructuring and asset impairment charges of $128
million ($91 million after-tax). Approximately 30% of the charges were related to our Services segment, 59% to our
Document Technology segment, and 11% to our Other segment and included the following:
•$143 million of severance costs related to headcount reductions of approximately 4,000 employees globally.
The actions impacted several functional areas, with approximately 53% of the costs focused on gross margin
improvements, 42% on SAG and 5% on the optimization of RD&E investments.
•$5 million for lease termination costs primarily reflecting continued optimization of our worldwide operating
locations.
• $7 million of asset impairment losses.
The above charges were partially offset by $27 million of net reversals for changes in estimated reserves from prior
period initiatives.
We expect 2015 pre-tax savings of approximately $100 million from our 2014 restructuring actions.
During the year ended December 31, 2013, we recorded net restructuring and asset impairment charges of $115
million ($82 million after-tax). Approximately 33% of the charges were related to our Services segment and 67% to
our Document Technology segment and included the following:
37