Xerox 2014 Annual Report Download - page 44
Download and view the complete annual report
Please find page 44 of the 2014 Xerox annual report below. You can navigate through the pages in the report by either clicking on the pages listed below, or by using the keyword search tool below to find specific information within the annual report.-
 1
1 -
2
-
3
-
4
-
5
-
6
-
7
-
8
-
9
-
10
-
11
-
12
-
13
-
14
-
15
-
16
-
17
-
18
-
19
-
20
-
21
-
22
-
23
-
24
-
25
-
26
-
27
-
28
-
29
-
30
-
31
-
32
-
33
-
 34
34 -
 35
35 -
 36
36 -
 37
37 -
 38
38 -
 39
39 -
 40
40 -
 41
41 -
 42
42 -
 43
43 -
 44
44 -
 45
45 -
 46
46 -
 47
47 -
 48
48 -
 49
49 -
 50
50 -
 51
51 -
 52
52 -
 53
53 -
 54
54 -
55
-
56
-
57
-
58
-
59
-
60
-
61
-
62
-
63
-
64
-
65
-
66
-
67
-
68
-
69
-
70
-
71
-
72
-
73
-
74
-
75
-
76
-
77
-
78
-
79
-
80
-
81
-
82
-
83
-
84
-
85
-
86
-
87
-
88
-
89
-
90
-
91
-
92
-
93
-
94
-
95
-
96
-
97
-
98
-
99
-
100
-
101
-
102
-
103
-
104
-
105
-
106
-
107
-
108
-
109
-
110
-
111
-
112
-
113
-
114
-
115
-
116
-
117
-
118
-
119
-
120
-
121
-
122
-
123
-
124
-
125
-
126
-
127
-
128
-
129
-
130
-
131
-
132
-
133
-
134
-
135
-
136
-
137
-
138
-
139
-
140
-
141
-
142
-
143
-
144
-
145
-
146
-
147
-
148
-
149
-
150
-
151
-
152
 |
 |

Bundled Lease Arrangements - We sell our equipment under bundled lease arrangements, which typically include
the equipment, service, supplies and a financing component for which the customer pays a single negotiated
monthly fixed price for all elements over the contractual lease term. Approximately 35% of our equipment sales
revenue is related to sales made under bundled lease arrangements. Recognizing revenues under these
arrangements requires us to allocate the total consideration received to the lease and non-lease deliverables
included in the bundled arrangement, based upon the estimated fair values of each element.
Sales to Distributors and Resellers - We utilize distributors and resellers to sell many of our technology products,
supplies and services to end-user customers. Sales to distributors and resellers are generally recognized as
revenue when products are sold to such distributors and resellers. Distributors and resellers participate in various
rebate, price-protection, cooperative marketing and other programs, and we record provisions and allowances for
these programs as a reduction to revenue when the sales occur. Similarly, we also record estimates for sales
returns and other discounts and allowances when the sales occur. We consider various factors, including a review
of specific transactions and programs, historical experience and market and economic conditions when calculating
these provisions and allowances. Approximately 11% of our revenues include sales to distributors and resellers and
provisions and allowances recorded on these sales are approximately 20% of the associated gross revenues.
Revenue Recognition for Services - Percentage-of-Completion - A portion of our Services revenue is recognized
using the percentage-of-completion (POC) accounting method. This method requires the use of estimates and
judgment. Approximately 3% of our Services revenues were recognized using the POC accounting method.
Although not significant to total Services revenue, the POC methodology is normally applied to certain of our larger
and longer term outsourcing contracts involving system development and implementation services, primarily in
government healthcare and certain government transportation contracts. In addition, we had unbilled receivables
totaling $360 and $345 at December 31, 2014 and 2013, respectively, representing revenues recognized but not yet
billable under the terms of our POC contracts.
The POC accounting methodology involves recognizing probable and reasonably estimable revenue using the
percentage of services completed based on a current cumulative cost incurred to estimated total cost basis and a
reasonably consistent profit margin over the period. Due to the long-term nature of these arrangements, developing
the estimates of cost often requires significant judgment. Factors that must be considered in estimating the progress
of work completed and ultimate cost of the projects include, but are not limited to, the availability of labor and labor
productivity, the nature and complexity of the work to be performed and the impact of delayed performance. If
changes occur in delivery, productivity or other factors used in developing the estimates of costs or revenues, we
revise our cost and revenue estimates, which may result in increases or decreases in revenues and costs. Such
revisions are reflected in income in the period in which the facts that give rise to that revision become known. We
perform ongoing profitability analysis of our POC services contracts in order to determine whether the latest
estimates require updating. Key factors reviewed by the company to estimate the future costs to complete each
contract are future labor costs, future product costs, expected productivity efficiencies, achievement of contracted
milestones and performance goals as well as potential penalties for milestone and system implementation delays.
If at any time our estimates indicate the POC contract will be unprofitable, the entire estimated loss for the
remainder of the contract is recorded immediately in cost of services and results in the contract being recorded at a
zero profit margin with recognition of an equal amount of revenues and costs.
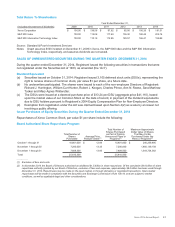
Allowance for Doubtful Accounts and Credit Losses
We continuously monitor collections and payments from our customers and maintain a provision for estimated credit
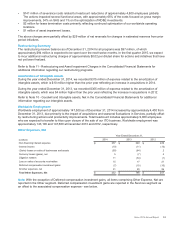
losses based upon our historical experience adjusted for current conditions. We recorded bad debt provisions of
$53 million, $120 million and $119 million in SAG expenses in our Consolidated Statements of Income for the years
ended December 31, 2014, 2013 and 2012, respectively.
Bad debt provisions declined in 2014 reflecting improved trends in write-offs throughout the year as well as a
continued disciplined credit process. Reserves, as a percentage of trade and finance receivables, were 3.1% at
December 31, 2014, as compared to 3.4% and 3.3% at December 31, 2013 and 2012. We continue to assess our
receivable portfolio in light of the current economic environment and its impact on our estimation of the adequacy of
the allowance for doubtful accounts.
29