Xerox 2014 Annual Report Download - page 39
Download and view the complete annual report
Please find page 39 of the 2014 Xerox annual report below. You can navigate through the pages in the report by either clicking on the pages listed below, or by using the keyword search tool below to find specific information within the annual report.-
 1
1 -
2
-
3
-
4
-
5
-
6
-
7
-
8
-
9
-
10
-
11
-
12
-
13
-
14
-
15
-
16
-
17
-
18
-
19
-
20
-
21
-
22
-
23
-
24
-
25
-
26
-
27
-
28
-
 29
29 -
 30
30 -
 31
31 -
 32
32 -
 33
33 -
 34
34 -
 35
35 -
 36
36 -
 37
37 -
 38
38 -
 39
39 -
 40
40 -
 41
41 -
 42
42 -
 43
43 -
 44
44 -
 45
45 -
 46
46 -
 47
47 -
 48
48 -
 49
49 -
50
-
51
-
52
-
53
-
54
-
55
-
56
-
57
-
58
-
59
-
60
-
61
-
62
-
63
-
64
-
65
-
66
-
67
-
68
-
69
-
70
-
71
-
72
-
73
-
74
-
75
-
76
-
77
-
78
-
79
-
80
-
81
-
82
-
83
-
84
-
85
-
86
-
87
-
88
-
89
-
90
-
91
-
92
-
93
-
94
-
95
-
96
-
97
-
98
-
99
-
100
-
101
-
102
-
103
-
104
-
105
-
106
-
107
-
108
-
109
-
110
-
111
-
112
-
113
-
114
-
115
-
116
-
117
-
118
-
119
-
120
-
121
-
122
-
123
-
124
-
125
-
126
-
127
-
128
-
129
-
130
-
131
-
132
-
133
-
134
-
135
-
136
-
137
-
138
-
139
-
140
-
141
-
142
-
143
-
144
-
145
-
146
-
147
-
148
-
149
-
150
-
151
-
152
 |
 |
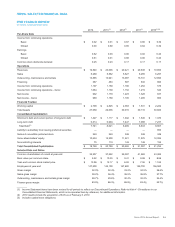
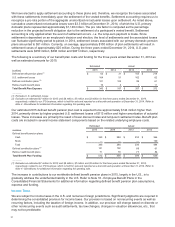
ITEM 6. SELECTED FINANCIAL DATA
FIVE YEARS IN REVIEW
(in millions, except per-share data)
2014 2013 (1) 2012(1) 2011(1) 2010(1),(2)
Per-Share Data
Income from continuing operations
Basic $ 0.92 $0.91 $0.87 $0.86 $0.39
Diluted 0.90 0.89 0.85 0.84 0.39
Earnings
Basic 0.82 0.93 0.90 0.92 0.44
Diluted 0.81 0.91 0.88 0.90 0.43
Common stock dividends declared 0.25 0.23 0.17 0.17 0.17
Operations
Revenues $ 19,540 $ 20,006 $ 20,421 $ 20,638 $19,650
Sales 5,288 5,582 5,827 6,265 6,297
Outsourcing, maintenance and rentals 13,865 13,941 13,997 13,741 12,693
Financing 387 483 597 632 660
Income from continuing operations 1,107 1,159 1,180 1,252 575
Income from continuing operations - Xerox 1,084 1,139 1,152 1,219 544
Net income 992 1,179 1,223 1,328 637
Net income - Xerox 969 1,159 1,195 1,295 606
Financial Position
Working capital $ 2,798 $2,825 $2,363 $1,531 $2,222
Total Assets 27,658 29,036 30,015 30,116 30,600
Consolidated Capitalization
Short-term debt and current portion of long-term debt $ 1,427 $1,117 $1,042 $1,545 $1,370
Long-term debt 6,314 6,904 7,447 7,088 7,237
Total Debt(3) 7,741 8,021 8,489 8,633 8,607
Liability to subsidiary trust issuing preferred securities — — — — 650
Series A convertible preferred stock 349 349 349 349 349
Xerox shareholders' equity 10,634 12,300 11,521 11,876 12,006
Noncontrolling interests 75 119 143 149 153
Total Consolidated Capitalization $18,799 $ 20,789 $ 20,502 $ 21,007 $21,765
Selected Data and Ratios
Common shareholders of record at year-end 35,307 37,552 39,397 41,982 43,383
Book value per common share $ 9.52 $10.35 $9.41 $8.88 $8.59
Year-end common stock market price $ 13.86 $12.17 $6.82 $7.96 $11.52
Employees at year-end 147,500 143,100 147,600 139,700 136,500
Gross margin 32.0%32.4%33.2%34.5%36.4%
Sales gross margin 38.2%36.4%36.5%36.8%37.7%
Outsourcing, maintenance and rentals gross margin 28.7%29.6%30.4%32.2%34.4%
Finance gross margin 63.8%66.3%66.8%63.4%62.7%
___________
(1) Income Statement items have been revised for all periods to reflect our Discontinued Operations. Refer to Note 4 - Divestitures in our
Consolidated Financial Statements, which is incorporated here by reference, for additional information.
(2) 2010 results include the acquisition of ACS as of February 5, 2010.
(3) Includes capital lease obligations.
Xerox 2014 Annual Report 24