Xcel Energy 2014 Annual Report Download - page 98
Download and view the complete annual report
Please find page 98 of the 2014 Xcel Energy annual report below. You can navigate through the pages in the report by either clicking on the pages listed below, or by using the keyword search tool below to find specific information within the annual report.-
 1
1 -
2
-
3
-
4
-
5
-
6
-
7
-
8
-
9
-
10
-
11
-
12
-
13
-
14
-
15
-
16
-
17
-
18
-
19
-
20
-
21
-
22
-
23
-
24
-
25
-
26
-
27
-
28
-
29
-
30
-
31
-
32
-
33
-
34
-
35
-
36
-
37
-
38
-
39
-
40
-
41
-
42
-
43
-
44
-
45
-
46
-
47
-
48
-
49
-
50
-
51
-
52
-
53
-
54
-
55
-
56
-
57
-
58
-
59
-
60
-
61
-
62
-
63
-
64
-
65
-
66
-
67
-
68
-
69
-
70
-
71
-
72
-
73
-
74
-
75
-
76
-
77
-
78
-
79
-
80
-
81
-
82
-
83
-
84
-
85
-
86
-
87
-
 88
88 -
 89
89 -
 90
90 -
 91
91 -
 92
92 -
 93
93 -
 94
94 -
 95
95 -
 96
96 -
 97
97 -
 98
98 -
 99
99 -
 100
100 -
 101
101 -
 102
102 -
 103
103 -
 104
104 -
 105
105 -
 106
106 -
 107
107 -
 108
108 -
109
-
110
-
111
-
112
-
113
-
114
-
115
-
116
-
117
-
118
-
119
-
120
-
121
-
122
-
123
-
124
-
125
-
126
-
127
-
128
-
129
-
130
-
131
-
132
-
133
-
134
-
135
-
136
-
137
-
138
-
139
-
140
-
141
-
142
-
143
-
144
-
145
-
146
-
147
-
148
-
149
-
150
-
151
-
152
-
153
-
154
-
155
-
156
-
157
-
158
-
159
-
160
-
161
-
162
-
163
-
164
-
165
-
166
-
167
-
168
-
169
-
170
-
171
-
172
-
173
-
174
-
175
-
176
-
177
-
178
-
179
-
180
-
181
-
182
-
183
-
184
 |
 |

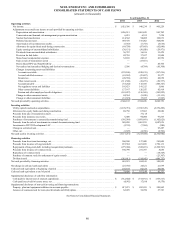
80
XCEL ENERGY INC. AND SUBSIDIARIES
CONSOLIDATED STATEMENTS OF CASH FLOWS
(amounts in thousands)
Year Ended Dec. 31
2014 2013 2012
Operating activities
Net income. . . . . . . . . . . . . . . . . . . . . . . . . . . . . . . . . . . . . . . . . . . . . . . . . . . . . . . . . . . . . . . . . . . . . . . . . . . . . . . $ 1,021,306 $ 948,234 $ 905,229
Adjustments to reconcile net income to cash provided by operating activities:
Depreciation and amortization. . . . . . . . . . . . . . . . . . . . . . . . . . . . . . . . . . . . . . . . . . . . . . . . . . . . . . . . . . . . . 1,036,515 1,001,843 943,702
Conservation and demand side management program amortization. . . . . . . . . . . . . . . . . . . . . . . . . . . . . . . . 6,033 6,531 7,258
Nuclear fuel amortization . . . . . . . . . . . . . . . . . . . . . . . . . . . . . . . . . . . . . . . . . . . . . . . . . . . . . . . . . . . . . . . . 114,542 98,089 102,651
Deferred income taxes . . . . . . . . . . . . . . . . . . . . . . . . . . . . . . . . . . . . . . . . . . . . . . . . . . . . . . . . . . . . . . . . . . . 569,378 515,062 508,094
Amortization of investment tax credits . . . . . . . . . . . . . . . . . . . . . . . . . . . . . . . . . . . . . . . . . . . . . . . . . . . . . . (5,543) (5,753) (6,610)
Allowance for equity funds used during construction. . . . . . . . . . . . . . . . . . . . . . . . . . . . . . . . . . . . . . . . . . . (89,750) (87,683) (62,840)
Equity earnings of unconsolidated subsidiaries. . . . . . . . . . . . . . . . . . . . . . . . . . . . . . . . . . . . . . . . . . . . . . . . (30,151) (30,020) (29,971)
Dividends from unconsolidated subsidiaries . . . . . . . . . . . . . . . . . . . . . . . . . . . . . . . . . . . . . . . . . . . . . . . . . . 36,707 36,416 33,470
Provision for bad debts . . . . . . . . . . . . . . . . . . . . . . . . . . . . . . . . . . . . . . . . . . . . . . . . . . . . . . . . . . . . . . . . . . 42,765 37,627 33,808
Share-based compensation expense. . . . . . . . . . . . . . . . . . . . . . . . . . . . . . . . . . . . . . . . . . . . . . . . . . . . . . . . . 32,189 24,613 26,970
Gain on sale of transmission assets . . . . . . . . . . . . . . . . . . . . . . . . . . . . . . . . . . . . . . . . . . . . . . . . . . . . . . . . . — (13,661) —
Prairie Island EPU and SmartGridCity . . . . . . . . . . . . . . . . . . . . . . . . . . . . . . . . . . . . . . . . . . . . . . . . . . . . . . — — 20,766
Net realized and unrealized hedging and derivative transactions . . . . . . . . . . . . . . . . . . . . . . . . . . . . . . . . . . 5,506 (4,704) (85,308)
Changes in operating assets and liabilities:
Accounts receivable . . . . . . . . . . . . . . . . . . . . . . . . . . . . . . . . . . . . . . . . . . . . . . . . . . . . . . . . . . . . . . . . . . . (125,146) (108,911) (197,236)
Accrued unbilled revenues . . . . . . . . . . . . . . . . . . . . . . . . . . . . . . . . . . . . . . . . . . . . . . . . . . . . . . . . . . . . . . (41,262) (23,867) 25,377
Inventories. . . . . . . . . . . . . . . . . . . . . . . . . . . . . . . . . . . . . . . . . . . . . . . . . . . . . . . . . . . . . . . . . . . . . . . . . . . (20,558) (43,588) 82,658
Other current assets. . . . . . . . . . . . . . . . . . . . . . . . . . . . . . . . . . . . . . . . . . . . . . . . . . . . . . . . . . . . . . . . . . . . (111,300) (18,071) (30,737)
Accounts payable . . . . . . . . . . . . . . . . . . . . . . . . . . . . . . . . . . . . . . . . . . . . . . . . . . . . . . . . . . . . . . . . . . . . . (53,242) 132,441 (100,327)
Net regulatory assets and liabilities . . . . . . . . . . . . . . . . . . . . . . . . . . . . . . . . . . . . . . . . . . . . . . . . . . . . . . . 195,823 141,325 5,866
Other current liabilities . . . . . . . . . . . . . . . . . . . . . . . . . . . . . . . . . . . . . . . . . . . . . . . . . . . . . . . . . . . . . . . . . 137,147 126,555 42,914
Pension and other employee benefit obligations . . . . . . . . . . . . . . . . . . . . . . . . . . . . . . . . . . . . . . . . . . . . . (101,457) (156,369) (183,922)
Change in other noncurrent assets . . . . . . . . . . . . . . . . . . . . . . . . . . . . . . . . . . . . . . . . . . . . . . . . . . . . . . . . . . 44,364 (9,998) (33,151)
Change in other noncurrent liabilities . . . . . . . . . . . . . . . . . . . . . . . . . . . . . . . . . . . . . . . . . . . . . . . . . . . . . . . (15,674) 17,925 (3,905)
Net cash provided by operating activities. . . . . . . . . . . . . . . . . . . . . . . . . . . . . . . . . . . . . . . . . . . . . . . . . . . . . . . . . 2,648,192 2,584,036 2,004,756
Investing activities
Utility capital/construction expenditures. . . . . . . . . . . . . . . . . . . . . . . . . . . . . . . . . . . . . . . . . . . . . . . . . . . . . . . . (3,199,791) (3,395,325) (2,570,209)
Allowance for equity funds used during construction. . . . . . . . . . . . . . . . . . . . . . . . . . . . . . . . . . . . . . . . . . . . . . 89,750 87,683 62,840
Proceeds from sale of transmission assets . . . . . . . . . . . . . . . . . . . . . . . . . . . . . . . . . . . . . . . . . . . . . . . . . . . . . . . — 37,118 —
Proceeds from insurance recoveries. . . . . . . . . . . . . . . . . . . . . . . . . . . . . . . . . . . . . . . . . . . . . . . . . . . . . . . . . . . . 6,000 90,000 97,835
Purchases of investments in external decommissioning fund . . . . . . . . . . . . . . . . . . . . . . . . . . . . . . . . . . . . . . . . (595,569) (1,481,881) (1,102,025)
Proceeds from the sale of investments in external decommissioning fund . . . . . . . . . . . . . . . . . . . . . . . . . . . . . . 588,430 1,461,291 1,087,076
Investment in WYCO Development LLC . . . . . . . . . . . . . . . . . . . . . . . . . . . . . . . . . . . . . . . . . . . . . . . . . . . . . . . (2,376) (7,504) (980)
Change in restricted cash . . . . . . . . . . . . . . . . . . . . . . . . . . . . . . . . . . . . . . . . . . . . . . . . . . . . . . . . . . . . . . . . . . . . — — 95,287
Other, net . . . . . . . . . . . . . . . . . . . . . . . . . . . . . . . . . . . . . . . . . . . . . . . . . . . . . . . . . . . . . . . . . . . . . . . . . . . . . . . . (3,695) (4,766) (2,766)
Net cash used in investing activities. . . . . . . . . . . . . . . . . . . . . . . . . . . . . . . . . . . . . . . . . . . . . . . . . . . . . . . . . . . . . (3,117,251) (3,213,384) (2,332,942)
Financing activities
Proceeds from short-term borrowings, net. . . . . . . . . . . . . . . . . . . . . . . . . . . . . . . . . . . . . . . . . . . . . . . . . . . . . . . 260,500 157,000 383,000
Proceeds from issuance of long-term debt. . . . . . . . . . . . . . . . . . . . . . . . . . . . . . . . . . . . . . . . . . . . . . . . . . . . . . . 837,584 1,431,895 1,790,131
Repayments of long-term debt, including reacquisition premiums. . . . . . . . . . . . . . . . . . . . . . . . . . . . . . . . . . . . (275,948) (652,451) (1,302,763)
Proceeds from issuance of common stock. . . . . . . . . . . . . . . . . . . . . . . . . . . . . . . . . . . . . . . . . . . . . . . . . . . . . . . 180,798 231,767 8,050
Repurchase of common stock . . . . . . . . . . . . . . . . . . . . . . . . . . . . . . . . . . . . . . . . . . . . . . . . . . . . . . . . . . . . . . . . — — (18,529)
Purchase of common stock for settlement of equity awards . . . . . . . . . . . . . . . . . . . . . . . . . . . . . . . . . . . . . . . . . — — (23,307)
Dividends paid . . . . . . . . . . . . . . . . . . . . . . . . . . . . . . . . . . . . . . . . . . . . . . . . . . . . . . . . . . . . . . . . . . . . . . . . . . . . (561,411) (514,042) (486,757)
Net cash provided by financing activities. . . . . . . . . . . . . . . . . . . . . . . . . . . . . . . . . . . . . . . . . . . . . . . . . . . . . . . . . 441,523 654,169 349,825
Net change in cash and cash equivalents . . . . . . . . . . . . . . . . . . . . . . . . . . . . . . . . . . . . . . . . . . . . . . . . . . . . . . . . . (27,536) 24,821 21,639
Cash and cash equivalents at beginning of period . . . . . . . . . . . . . . . . . . . . . . . . . . . . . . . . . . . . . . . . . . . . . . . . . . 107,144 82,323 60,684
Cash and cash equivalents at end of period . . . . . . . . . . . . . . . . . . . . . . . . . . . . . . . . . . . . . . . . . . . . . . . . . . . . . . . $ 79,608 $ 107,144 $ 82,323
Supplemental disclosure of cash flow information:
Cash paid for interest (net of amounts capitalized) . . . . . . . . . . . . . . . . . . . . . . . . . . . . . . . . . . . . . . . . . . . . . . . . $ (512,602) $ (514,911) $ (563,517)
Cash (paid) received for income taxes, net . . . . . . . . . . . . . . . . . . . . . . . . . . . . . . . . . . . . . . . . . . . . . . . . . . . . . . (4,542) 17,188 (9,570)
Supplemental disclosure of non-cash investing and financing transactions:
Property, plant and equipment additions in accounts payable. . . . . . . . . . . . . . . . . . . . . . . . . . . . . . . . . . . . . . . . $ 417,473 $ 452,453 $ 289,802
Issuance of common stock for reinvested dividends and 401(k) plans . . . . . . . . . . . . . . . . . . . . . . . . . . . . . . . . . 62,078 56,950 67,723
See Notes to Consolidated Financial Statements