Xcel Energy 2014 Annual Report Download - page 135
Download and view the complete annual report
Please find page 135 of the 2014 Xcel Energy annual report below. You can navigate through the pages in the report by either clicking on the pages listed below, or by using the keyword search tool below to find specific information within the annual report.-
 1
1 -
2
-
3
-
4
-
5
-
6
-
7
-
8
-
9
-
10
-
11
-
12
-
13
-
14
-
15
-
16
-
17
-
18
-
19
-
20
-
21
-
22
-
23
-
24
-
25
-
26
-
27
-
28
-
29
-
30
-
31
-
32
-
33
-
34
-
35
-
36
-
37
-
38
-
39
-
40
-
41
-
42
-
43
-
44
-
45
-
46
-
47
-
48
-
49
-
50
-
51
-
52
-
53
-
54
-
55
-
56
-
57
-
58
-
59
-
60
-
61
-
62
-
63
-
64
-
65
-
66
-
67
-
68
-
69
-
70
-
71
-
72
-
73
-
74
-
75
-
76
-
77
-
78
-
79
-
80
-
81
-
82
-
83
-
84
-
85
-
86
-
87
-
88
-
89
-
90
-
91
-
92
-
93
-
94
-
95
-
96
-
97
-
98
-
99
-
100
-
101
-
102
-
103
-
104
-
105
-
106
-
107
-
108
-
109
-
110
-
111
-
112
-
113
-
114
-
115
-
116
-
117
-
118
-
119
-
120
-
121
-
122
-
123
-
124
-
 125
125 -
 126
126 -
 127
127 -
 128
128 -
 129
129 -
 130
130 -
 131
131 -
 132
132 -
 133
133 -
 134
134 -
 135
135 -
 136
136 -
 137
137 -
 138
138 -
 139
139 -
 140
140 -
 141
141 -
 142
142 -
 143
143 -
 144
144 -
 145
145 -
146
-
147
-
148
-
149
-
150
-
151
-
152
-
153
-
154
-
155
-
156
-
157
-
158
-
159
-
160
-
161
-
162
-
163
-
164
-
165
-
166
-
167
-
168
-
169
-
170
-
171
-
172
-
173
-
174
-
175
-
176
-
177
-
178
-
179
-
180
-
181
-
182
-
183
-
184
 |
 |

117
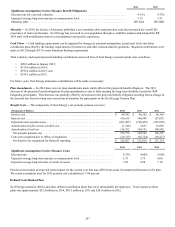
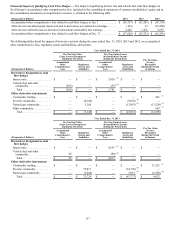
Financial Impact of Qualifying Cash Flow Hedges — The impact of qualifying interest rate and vehicle fuel cash flow hedges on
Xcel Energy’s accumulated other comprehensive loss, included in the consolidated statements of common stockholders’ equity and in
the consolidated statements of comprehensive income, is detailed in the following table:
(Thousands of Dollars) 2014 2013 2012
Accumulated other comprehensive loss related to cash flow hedges at Jan. 1 . . . . . . . . . . . . $ (59,753) $ (61,241) $ (45,738)
After-tax net unrealized gains (losses) related to derivatives accounted for as hedges . . . . . . (163) 12 (19,200)
After-tax net realized losses on derivative transactions reclassified into earnings . . . . . . . . . 2,288 1,476 3,697
Accumulated other comprehensive loss related to cash flow hedges at Dec. 31. . . . . . . . . . . $ (57,628) $ (59,753) $ (61,241)
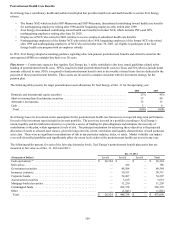
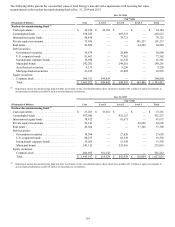
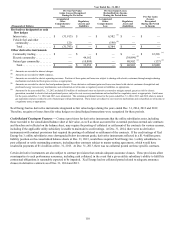
The following tables detail the impact of derivative activity during the years ended Dec. 31, 2014, 2013 and 2012, on accumulated
other comprehensive loss, regulatory assets and liabilities, and income:
Year Ended Dec. 31, 2014
Pre-Tax Fair Value
Gains (Losses) Recognized
During the Period in:
Pre-Tax (Gains) Losses
Reclassified into Income
During the Period from: Pre-Tax Gains
(Losses)
Recognized
During the Period
in Income(Thousands of Dollars)
Accumulated
Other
Comprehensive
Loss
Regulatory
(Assets) and
Liabilities
Accumulated
Other
Comprehensive
Loss
Regulatory
Assets and
(Liabilities)
Derivatives designated as cash
flow hedges
Interest rate . . . . . . . . . . . . . . . . . $ — $ — $ 3,836 (a) $ — $ —
Vehicle fuel and other
commodity. . . . . . . . . . . . . . . . (266) — (55)(b) — —
Total . . . . . . . . . . . . . . . . . . . . $ (266) $ — $ 3,781 $ — $ —
Other derivative instruments
Commodity trading . . . . . . . . . . . $ — $ — $ — $ — $ 881 (c)
Electric commodity. . . . . . . . . . . — (8,306) — (9,036)(d) —
Natural gas commodity. . . . . . . . — 5,166 — (13,997)(e) (13,220) (e)
Other commodity . . . . . . . . . . . . — — — — 643 (c)
Total . . . . . . . . . . . . . . . . . . . . $ — $ (3,140) $ — $ (23,033) $ (11,696)
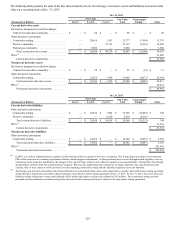
Year Ended Dec. 31, 2013
Pre-Tax Fair Value
Gains (Losses) Recognized
During the Period in:
Pre-Tax (Gains) Losses
Reclassified into Income
During the Period from: Pre-Tax Gains
(Losses)
Recognized
During the Period
in Income(Thousands of Dollars)
Accumulated
Other
Comprehensive
Loss
Regulatory
(Assets) and
Liabilities
Accumulated
Other
Comprehensive
Loss
Regulatory
Assets and
(Liabilities)
Derivatives designated as cash
flow hedges
Interest rate . . . . . . . . . . . . . . . . . $ — $ — $ 4,107 (a) $ — $ —
Vehicle fuel and other
commodity. . . . . . . . . . . . . . . . 29 — (90)(b) — —
Total . . . . . . . . . . . . . . . . . . . . $ 29 $ — $ 4,017 $ — $ —
Other derivative instruments
Commodity trading . . . . . . . . . . . $ — $ — $ — $ — $ 11,221 (c)
Electric commodity. . . . . . . . . . . — 75,817 — (52,796)(d) —
Natural gas commodity. . . . . . . . — (3,088) — 5,019 (e) (6,589) (d)
Total . . . . . . . . . . . . . . . . . . . . $ — $ 72,729 $ — $ (47,777) $ 4,632