Xcel Energy 2014 Annual Report Download - page 168
Download and view the complete annual report
Please find page 168 of the 2014 Xcel Energy annual report below. You can navigate through the pages in the report by either clicking on the pages listed below, or by using the keyword search tool below to find specific information within the annual report.-
 1
1 -
2
-
3
-
4
-
5
-
6
-
7
-
8
-
9
-
10
-
11
-
12
-
13
-
14
-
15
-
16
-
17
-
18
-
19
-
20
-
21
-
22
-
23
-
24
-
25
-
26
-
27
-
28
-
29
-
30
-
31
-
32
-
33
-
34
-
35
-
36
-
37
-
38
-
39
-
40
-
41
-
42
-
43
-
44
-
45
-
46
-
47
-
48
-
49
-
50
-
51
-
52
-
53
-
54
-
55
-
56
-
57
-
58
-
59
-
60
-
61
-
62
-
63
-
64
-
65
-
66
-
67
-
68
-
69
-
70
-
71
-
72
-
73
-
74
-
75
-
76
-
77
-
78
-
79
-
80
-
81
-
82
-
83
-
84
-
85
-
86
-
87
-
88
-
89
-
90
-
91
-
92
-
93
-
94
-
95
-
96
-
97
-
98
-
99
-
100
-
101
-
102
-
103
-
104
-
105
-
106
-
107
-
108
-
109
-
110
-
111
-
112
-
113
-
114
-
115
-
116
-
117
-
118
-
119
-
120
-
121
-
122
-
123
-
124
-
125
-
126
-
127
-
128
-
129
-
130
-
131
-
132
-
133
-
134
-
135
-
136
-
137
-
138
-
139
-
140
-
141
-
142
-
143
-
144
-
145
-
146
-
147
-
148
-
149
-
150
-
151
-
152
-
153
-
154
-
155
-
156
-
157
-
 158
158 -
 159
159 -
 160
160 -
 161
161 -
 162
162 -
 163
163 -
 164
164 -
 165
165 -
 166
166 -
 167
167 -
 168
168 -
 169
169 -
 170
170 -
 171
171 -
 172
172 -
 173
173 -
 174
174 -
 175
175 -
 176
176 -
 177
177 -
 178
178 -
179
-
180
-
181
-
182
-
183
-
184
 |
 |

150
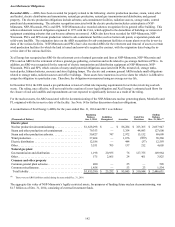
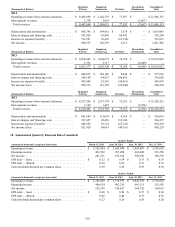
(Thousands of Dollars) Regulated
Electric Regulated
Natural Gas All Other Reconciling
Eliminations Consolidated
Total
2014
Operating revenues from external customers . . . . . . . $ 9,465,890 $ 2,142,738 $ 77,507 $ — $ 11,686,135
Intersegment revenues. . . . . . . . . . . . . . . . . . . . . . . . . 1,774 5,893 — (7,667) —
Total revenues. . . . . . . . . . . . . . . . . . . . . . . . . . . . . . $ 9,467,664 $ 2,148,631 $ 77,507 $ (7,667) $ 11,686,135
Depreciation and amortization . . . . . . . . . . . . . . . . . . $ 866,746 $ 144,661 $ 7,638 $ — $ 1,019,045
Interest charges and financing costs . . . . . . . . . . . . . . 397,824 43,940 86,442 — 528,206
Income tax expense (benefit). . . . . . . . . . . . . . . . . . . . 512,551 76,418 (65,154) — 523,815
Net income. . . . . . . . . . . . . . . . . . . . . . . . . . . . . . . . . . 890,535 128,559 2,212 — 1,021,306
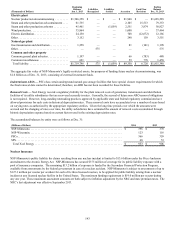
(Thousands of Dollars) Regulated
Electric Regulated
Natural Gas All Other Reconciling
Eliminations Consolidated
Total
2013
Operating revenues from external customers . . . . . . . $ 9,034,045 $ 1,804,679 $ 76,198 $ — $ 10,914,922
Intersegment revenues. . . . . . . . . . . . . . . . . . . . . . . . . 1,332 2,717 — (4,049) —
Total revenues. . . . . . . . . . . . . . . . . . . . . . . . . . . . . . $ 9,035,377 $ 1,807,396 $ 76,198 $ (4,049) $ 10,914,922
Depreciation and amortization . . . . . . . . . . . . . . . . . . $ 840,833 $ 128,186 $ 8,844 $ — $ 977,863
Interest charges and financing costs . . . . . . . . . . . . . . 386,198 44,927 104,895 — 536,020
Income tax expense (benefit). . . . . . . . . . . . . . . . . . . . 495,044 25,543 (36,611) — 483,976
Net income (loss). . . . . . . . . . . . . . . . . . . . . . . . . . . . . 850,572 123,702 (26,040) — 948,234
(Thousands of Dollars) Regulated
Electric Regulated
Natural Gas All Other Reconciling
Eliminations Consolidated
Total
2012
Operating revenues from external customers . . . . . . . $ 8,517,296 $ 1,537,374 $ 73,553 $ — $ 10,128,223
Intersegment revenues. . . . . . . . . . . . . . . . . . . . . . . . . 1,169 1,425 — (2,594) —
Total revenues. . . . . . . . . . . . . . . . . . . . . . . . . . . . . . $ 8,518,465 $ 1,538,799 $ 73,553 $ (2,594) $ 10,128,223
Depreciation and amortization . . . . . . . . . . . . . . . . . . $ 801,649 $ 115,038 $ 9,366 $ — $ 926,053
Interest charges and financing costs . . . . . . . . . . . . . . 397,457 49,456 119,324 — 566,237
Income tax expense (benefit). . . . . . . . . . . . . . . . . . . . 465,626 50,322 (65,745) — 450,203
Net income (loss). . . . . . . . . . . . . . . . . . . . . . . . . . . . . 851,929 98,061 (44,761) — 905,229
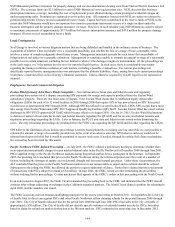
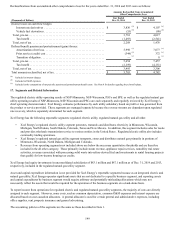
18. Summarized Quarterly Financial Data (Unaudited)
Quarter Ended
(Amounts in thousands, except per share data) March 31, 2014 June 30, 2014 Sept. 30, 2014 Dec. 31, 2014
Operating revenues . . . . . . . . . . . . . . . . . . . . . . . . . . . . . . . . . . . . $ 3,202,604 $ 2,685,096 $ 2,869,807 $ 2,928,628
Operating income . . . . . . . . . . . . . . . . . . . . . . . . . . . . . . . . . . . . . 493,992 397,208 665,680 391,250
Net income . . . . . . . . . . . . . . . . . . . . . . . . . . . . . . . . . . . . . . . . . . 261,221 195,164 368,582 196,339
EPS total — basic . . . . . . . . . . . . . . . . . . . . . . . . . . . . . . . . . . . . . $ 0.52 $ 0.39 $ 0.73 $ 0.39
EPS total — diluted. . . . . . . . . . . . . . . . . . . . . . . . . . . . . . . . . . . . 0.52 0.39 0.73 0.39
Cash dividends declared per common share. . . . . . . . . . . . . . . . . 0.30 0.30 0.30 0.30
Quarter Ended
(Amounts in thousands, except per share data) March 31, 2013 June 30, 2013 Sept. 30, 2013 Dec. 31, 2013
Operating revenues . . . . . . . . . . . . . . . . . . . . . . . . . . . . . . . . . . . . $ 2,782,849 $ 2,578,913 $ 2,822,338 $ 2,730,822
Operating income . . . . . . . . . . . . . . . . . . . . . . . . . . . . . . . . . . . . . 454,624 402,236 665,113 325,582
Net income . . . . . . . . . . . . . . . . . . . . . . . . . . . . . . . . . . . . . . . . . . 236,570 196,857 364,752 150,055
EPS total — basic . . . . . . . . . . . . . . . . . . . . . . . . . . . . . . . . . . . . . $ 0.48 $ 0.40 $ 0.73 $ 0.30
EPS total — diluted. . . . . . . . . . . . . . . . . . . . . . . . . . . . . . . . . . . . 0.48 0.40 0.73 0.30
Cash dividends declared per common share. . . . . . . . . . . . . . . . . 0.27 0.28 0.28 0.28