Xcel Energy 2014 Annual Report Download - page 127
Download and view the complete annual report
Please find page 127 of the 2014 Xcel Energy annual report below. You can navigate through the pages in the report by either clicking on the pages listed below, or by using the keyword search tool below to find specific information within the annual report.-
 1
1 -
2
-
3
-
4
-
5
-
6
-
7
-
8
-
9
-
10
-
11
-
12
-
13
-
14
-
15
-
16
-
17
-
18
-
19
-
20
-
21
-
22
-
23
-
24
-
25
-
26
-
27
-
28
-
29
-
30
-
31
-
32
-
33
-
34
-
35
-
36
-
37
-
38
-
39
-
40
-
41
-
42
-
43
-
44
-
45
-
46
-
47
-
48
-
49
-
50
-
51
-
52
-
53
-
54
-
55
-
56
-
57
-
58
-
59
-
60
-
61
-
62
-
63
-
64
-
65
-
66
-
67
-
68
-
69
-
70
-
71
-
72
-
73
-
74
-
75
-
76
-
77
-
78
-
79
-
80
-
81
-
82
-
83
-
84
-
85
-
86
-
87
-
88
-
89
-
90
-
91
-
92
-
93
-
94
-
95
-
96
-
97
-
98
-
99
-
100
-
101
-
102
-
103
-
104
-
105
-
106
-
107
-
108
-
109
-
110
-
111
-
112
-
113
-
114
-
115
-
116
-
 117
117 -
 118
118 -
 119
119 -
 120
120 -
 121
121 -
 122
122 -
 123
123 -
 124
124 -
 125
125 -
 126
126 -
 127
127 -
 128
128 -
 129
129 -
 130
130 -
 131
131 -
 132
132 -
 133
133 -
 134
134 -
 135
135 -
 136
136 -
 137
137 -
138
-
139
-
140
-
141
-
142
-
143
-
144
-
145
-
146
-
147
-
148
-
149
-
150
-
151
-
152
-
153
-
154
-
155
-
156
-
157
-
158
-
159
-
160
-
161
-
162
-
163
-
164
-
165
-
166
-
167
-
168
-
169
-
170
-
171
-
172
-
173
-
174
-
175
-
176
-
177
-
178
-
179
-
180
-
181
-
182
-
183
-
184
 |
 |

109
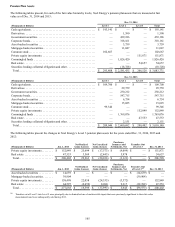
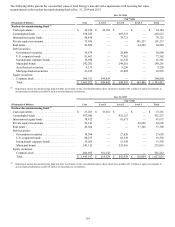
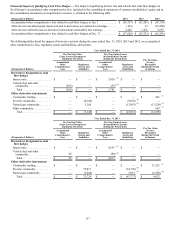
Dec. 31, 2013
(Thousands of Dollars) Level 1 Level 2 Level 3 Total
Cash equivalents (a) . . . . . . . . . . . . . . . . . . . . . . . . . . . . . . . . . . . . . . . . . . . $ 20,438 $ — $ — $ 20,438
Derivatives. . . . . . . . . . . . . . . . . . . . . . . . . . . . . . . . . . . . . . . . . . . . . . . . . . — (414) — (414)
Government securities . . . . . . . . . . . . . . . . . . . . . . . . . . . . . . . . . . . . . . . . . — 58,421 — 58,421
Insurance contracts. . . . . . . . . . . . . . . . . . . . . . . . . . . . . . . . . . . . . . . . . . . . — 52,808 — 52,808
Corporate bonds. . . . . . . . . . . . . . . . . . . . . . . . . . . . . . . . . . . . . . . . . . . . . . — 51,861 — 51,861
Asset-backed securities . . . . . . . . . . . . . . . . . . . . . . . . . . . . . . . . . . . . . . . . — 3,358 — 3,358
Mortgage-backed securities . . . . . . . . . . . . . . . . . . . . . . . . . . . . . . . . . . . . . — 24,246 — 24,246
Commingled funds. . . . . . . . . . . . . . . . . . . . . . . . . . . . . . . . . . . . . . . . . . . . — 298,258 — 298,258
Other . . . . . . . . . . . . . . . . . . . . . . . . . . . . . . . . . . . . . . . . . . . . . . . . . . . . . . — (16,940) — (16,940)
Total. . . . . . . . . . . . . . . . . . . . . . . . . . . . . . . . . . . . . . . . . . . . . . . . . . . . . . $ 20,438 $ 471,598 $ — $ 492,036
(a) Includes restricted cash of $1.0 million and $0.7 million at Dec. 31, 2014 and 2013, respectively.
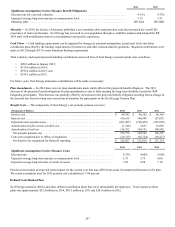
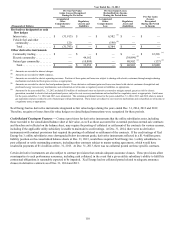
For the year ended Dec. 31, 2014 there were no assets transferred in or out of Level 3. The following tables present the changes in
Xcel Energy’s Level 3 postretirement benefit plan assets for the years ended Dec. 31, 2013 and 2012:
(Thousands of Dollars) Jan. 1, 2013 Net Realized
Gains (Losses) Net Unrealized
Gains (Losses)
Purchases,
Issuances and
Settlements, Net Transfers Out
of Level 3 (a) Dec. 31, 2013
Asset-backed securities . . . . . . . . . . $ 757 $ — $ — $ — $ (757) $ —
Mortgage-backed securities. . . . . . . 39,958 — — — (39,958) —
Total. . . . . . . . . . . . . . . . . . . . . . . . $ 40,715 $ — $ — $ — $ (40,715) $ —
(a) Transfers out of Level 3 into Level 2 were principally due to diminished use of unobservable inputs that were previously significant to these fair value
measurements and were subsequently sold during 2013.
(Thousands of Dollars) Jan. 1, 2012 Net Realized
Gains (Losses) Net Unrealized
Gains (Losses)
Purchases,
Issuances and
Settlements, Net Transfers Out
of Level 3 Dec. 31, 2012
Asset-backed securities . . . . . . . . . . $ 7,867 $ (331) $ 1,481 $ (8,260) $ — $ 757
Mortgage-backed securities. . . . . . . 27,253 (724) 3,301 10,128 — 39,958
Private equity investments. . . . . . . . 479 — (65)(414) — —
Real estate . . . . . . . . . . . . . . . . . . . . 144 — 35 (179) — —
Total. . . . . . . . . . . . . . . . . . . . . . . . $ 35,743 $ (1,055) $ 4,752 $ 1,275 $ — $ 40,715
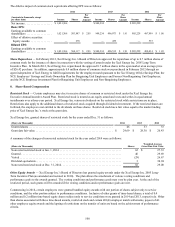
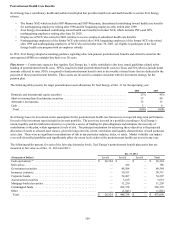
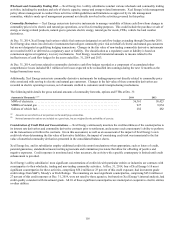
Benefit Obligations — A comparison of the actuarially computed benefit obligation and plan assets for Xcel Energy is presented in
the following table:
(Thousands of Dollars) 2014 2013
Change in Projected Benefit Obligation:
Obligation at Jan. 1. . . . . . . . . . . . . . . . . . . . . . . . . . . . . . . . . . . . . . . . . . . . . . . . . . . . . . . . . . . . . . . . $ 731,428 $ 851,952
Service cost . . . . . . . . . . . . . . . . . . . . . . . . . . . . . . . . . . . . . . . . . . . . . . . . . . . . . . . . . . . . . . . . . . . . . 3,457 4,079
Interest cost . . . . . . . . . . . . . . . . . . . . . . . . . . . . . . . . . . . . . . . . . . . . . . . . . . . . . . . . . . . . . . . . . . . . . 34,028 32,141
Medicare subsidy reimbursements. . . . . . . . . . . . . . . . . . . . . . . . . . . . . . . . . . . . . . . . . . . . . . . . . . . . 1,861 1,197
Plan amendments . . . . . . . . . . . . . . . . . . . . . . . . . . . . . . . . . . . . . . . . . . . . . . . . . . . . . . . . . . . . . . . . . — (14,571)
Plan participants’ contributions . . . . . . . . . . . . . . . . . . . . . . . . . . . . . . . . . . . . . . . . . . . . . . . . . . . . . . 7,148 9,580
Actuarial gain. . . . . . . . . . . . . . . . . . . . . . . . . . . . . . . . . . . . . . . . . . . . . . . . . . . . . . . . . . . . . . . . . . . . (81,699) (103,359)
Benefit payments . . . . . . . . . . . . . . . . . . . . . . . . . . . . . . . . . . . . . . . . . . . . . . . . . . . . . . . . . . . . . . . . . (53,354) (49,591)
Obligation at Dec. 31. . . . . . . . . . . . . . . . . . . . . . . . . . . . . . . . . . . . . . . . . . . . . . . . . . . . . . . . . . . . . $ 642,869 $ 731,428
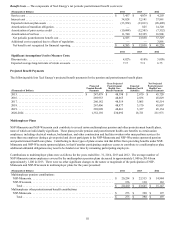
(Thousands of Dollars) 2014 2013
Change in Fair Value of Plan Assets:
Fair value of plan assets at Jan. 1. . . . . . . . . . . . . . . . . . . . . . . . . . . . . . . . . . . . . . . . . . . . . . . . . . . . . $ 492,036 $ 480,842
Actual return on plan assets . . . . . . . . . . . . . . . . . . . . . . . . . . . . . . . . . . . . . . . . . . . . . . . . . . . . . . . . . 12,083 33,644
Plan participants’ contributions . . . . . . . . . . . . . . . . . . . . . . . . . . . . . . . . . . . . . . . . . . . . . . . . . . . . . . 7,148 9,580
Employer contributions . . . . . . . . . . . . . . . . . . . . . . . . . . . . . . . . . . . . . . . . . . . . . . . . . . . . . . . . . . . . 17,145 17,561
Benefit payments . . . . . . . . . . . . . . . . . . . . . . . . . . . . . . . . . . . . . . . . . . . . . . . . . . . . . . . . . . . . . . . . . (53,354) (49,591)
Fair value of plan assets at Dec. 31 . . . . . . . . . . . . . . . . . . . . . . . . . . . . . . . . . . . . . . . . . . . . . . . . . . $ 475,058 $ 492,036