Xcel Energy 2014 Annual Report Download - page 125
Download and view the complete annual report
Please find page 125 of the 2014 Xcel Energy annual report below. You can navigate through the pages in the report by either clicking on the pages listed below, or by using the keyword search tool below to find specific information within the annual report.-
 1
1 -
2
-
3
-
4
-
5
-
6
-
7
-
8
-
9
-
10
-
11
-
12
-
13
-
14
-
15
-
16
-
17
-
18
-
19
-
20
-
21
-
22
-
23
-
24
-
25
-
26
-
27
-
28
-
29
-
30
-
31
-
32
-
33
-
34
-
35
-
36
-
37
-
38
-
39
-
40
-
41
-
42
-
43
-
44
-
45
-
46
-
47
-
48
-
49
-
50
-
51
-
52
-
53
-
54
-
55
-
56
-
57
-
58
-
59
-
60
-
61
-
62
-
63
-
64
-
65
-
66
-
67
-
68
-
69
-
70
-
71
-
72
-
73
-
74
-
75
-
76
-
77
-
78
-
79
-
80
-
81
-
82
-
83
-
84
-
85
-
86
-
87
-
88
-
89
-
90
-
91
-
92
-
93
-
94
-
95
-
96
-
97
-
98
-
99
-
100
-
101
-
102
-
103
-
104
-
105
-
106
-
107
-
108
-
109
-
110
-
111
-
112
-
113
-
114
-
 115
115 -
 116
116 -
 117
117 -
 118
118 -
 119
119 -
 120
120 -
 121
121 -
 122
122 -
 123
123 -
 124
124 -
 125
125 -
 126
126 -
 127
127 -
 128
128 -
 129
129 -
 130
130 -
 131
131 -
 132
132 -
 133
133 -
 134
134 -
 135
135 -
136
-
137
-
138
-
139
-
140
-
141
-
142
-
143
-
144
-
145
-
146
-
147
-
148
-
149
-
150
-
151
-
152
-
153
-
154
-
155
-
156
-
157
-
158
-
159
-
160
-
161
-
162
-
163
-
164
-
165
-
166
-
167
-
168
-
169
-
170
-
171
-
172
-
173
-
174
-
175
-
176
-
177
-
178
-
179
-
180
-
181
-
182
-
183
-
184
 |
 |

107
2014 2013
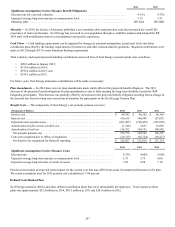
Significant Assumptions Used to Measure Benefit Obligations:
Discount rate for year-end valuation . . . . . . . . . . . . . . . . . . . . . . . . . . . . . . . . . . . . . . . . . . . . . . . . . . 4.11% 4.75%
Expected average long-term increase in compensation level. . . . . . . . . . . . . . . . . . . . . . . . . . . . . . . . 3.75 3.75
Mortality table . . . . . . . . . . . . . . . . . . . . . . . . . . . . . . . . . . . . . . . . . . . . . . . . . . . . . . . . . . . . . . . . . . . RP 2014 RP 2000
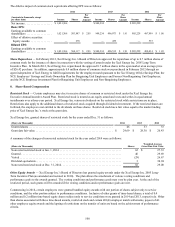
Mortality — In 2014, the Society of Actuaries published a new mortality table and projection scale that increased the overall life
expectancy of males and females. Xcel Energy has reviewed its own population through a credibility analysis and adopted the RP
2014 table with modifications based on its population and specific experience.
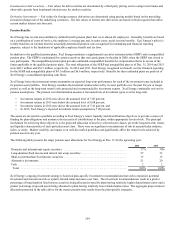
Cash Flows — Cash funding requirements can be impacted by changes to actuarial assumptions, actual asset levels and other
calculations prescribed by the funding requirements of income tax and other pension-related regulations. Required contributions were
made in 2012 through 2015 to meet minimum funding requirements.
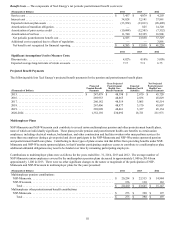
Total voluntary and required pension funding contributions across all four of Xcel Energy’s pension plans were as follows:
• $90.0 million in January 2015;
• $130.6 million in 2014;
• $192.4 million in 2013; and
• $198.1 million in 2012.
For future years, Xcel Energy anticipates contributions will be made as necessary.
Plan Amendments — In 2014 there were no plan amendments made which affected the projected benefit obligation. The 2013
decrease of the projected benefit obligation for plan amendments is due to fully insuring the long-term disability benefit for NSP
bargaining participants. This decrease was partially offset by an increase to the projected benefit obligation resulting from a change in
the discount rate basis for lump sum conversion of annuities for participants in the Xcel Energy Pension Plan.
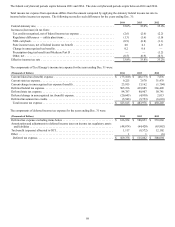
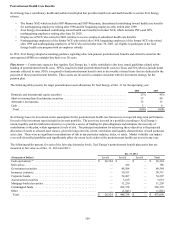
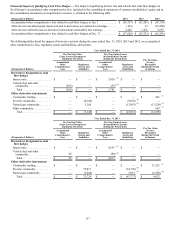
Benefit Costs — The components of Xcel Energy’s net periodic pension cost were:
(Thousands of Dollars) 2014 2013 2012
Service cost . . . . . . . . . . . . . . . . . . . . . . . . . . . . . . . . . . . . . . . . . . . . . . . . . . . . . . . . . . . . . $ 88,342 $ 96,282 $ 86,364
Interest cost . . . . . . . . . . . . . . . . . . . . . . . . . . . . . . . . . . . . . . . . . . . . . . . . . . . . . . . . . . . . . 156,619 140,690 157,035
Expected return on plan assets . . . . . . . . . . . . . . . . . . . . . . . . . . . . . . . . . . . . . . . . . . . . . . (207,205)(198,452) (207,095)
Amortization of prior service (credit) cost . . . . . . . . . . . . . . . . . . . . . . . . . . . . . . . . . . . . . (1,746) 5,871 21,065
Amortization of net loss . . . . . . . . . . . . . . . . . . . . . . . . . . . . . . . . . . . . . . . . . . . . . . . . . . . 116,762 144,151 108,982
Net periodic pension cost . . . . . . . . . . . . . . . . . . . . . . . . . . . . . . . . . . . . . . . . . . . . . . . . . 152,772 188,542 166,351
Costs not recognized due to effects of regulation . . . . . . . . . . . . . . . . . . . . . . . . . . . . . . . . (26,315)(36,724) (39,217)
Net benefit cost recognized for financial reporting. . . . . . . . . . . . . . . . . . . . . . . . . . . . . . $ 126,457 $ 151,818 $ 127,134
2014 2013 2012
Significant Assumptions Used to Measure Costs:
Discount rate . . . . . . . . . . . . . . . . . . . . . . . . . . . . . . . . . . . . . . . . . . . . . . . . . . . . . . . . . . . . 4.75% 4.00% 5.00%
Expected average long-term increase in compensation level . . . . . . . . . . . . . . . . . . . . . . . 3.75 3.75 4.00
Expected average long-term rate of return on assets. . . . . . . . . . . . . . . . . . . . . . . . . . . . . . 7.05 6.88 7.10
Pension costs include an expected return impact for the current year that may differ from actual investment performance in the plan.
The return assumption used for 2015 pension cost calculations is 7.09 percent.
Defined Contribution Plans
Xcel Energy maintains 401(k) and other defined contribution plans that cover substantially all employees. Total expense to these
plans was approximately $32.4 million in 2014, $30.3 million in 2013 and $28.0 million in 2012.