Xcel Energy 2014 Annual Report Download - page 113
Download and view the complete annual report
Please find page 113 of the 2014 Xcel Energy annual report below. You can navigate through the pages in the report by either clicking on the pages listed below, or by using the keyword search tool below to find specific information within the annual report.
95
5. Joint Ownership of Generation, Transmission and Gas Facilities
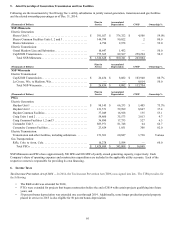
Following are the investments by Xcel Energy Inc.’s utility subsidiaries in jointly owned generation, transmission and gas facilities
and the related ownership percentages as of Dec. 31, 2014:
(Thousands of Dollars) Plant in
Service Accumulated
Depreciation CWIP Ownership %
NSP-Minnesota
Electric Generation:
Sherco Unit 3 . . . . . . . . . . . . . . . . . . . . . . . . . . . . . . . . . . . . . . . . . $ 591,027 $ 376,322 $ 4,508 59.0%
Sherco Common Facilities Units 1, 2 and 3 . . . . . . . . . . . . . . . . . 144,799 90,022 2 80.0
Sherco Substation. . . . . . . . . . . . . . . . . . . . . . . . . . . . . . . . . . . . . . 4,790 2,978 — 59.0
Electric Transmission:
Grand Meadow Line and Substation . . . . . . . . . . . . . . . . . . . . . . . 10,647 1,452 — 50.0
CapX2020 Transmission . . . . . . . . . . . . . . . . . . . . . . . . . . . . . . . . 775,365 89,567 259,294 50.9
Total NSP-Minnesota . . . . . . . . . . . . . . . . . . . . . . . . . . . . . . . . $ 1,526,628 $ 560,341 $ 263,804
(Thousands of Dollars) Plant in
Service Accumulated
Depreciation CWIP Ownership %
NSP-Wisconsin
Electric Transmission:
CapX2020 Transmission . . . . . . . . . . . . . . . . . . . . . . . . . . . . . . . . $ 26,434 $ 8,082 $ 103,940 80.7%
La Crosse, Wis. to Madison, Wis. . . . . . . . . . . . . . . . . . . . . . . . . . — — 9,814 50.0
Total NSP-Wisconsin . . . . . . . . . . . . . . . . . . . . . . . . . . . . . . . . $ 26,434 $ 8,082 $ 113,754
(Thousands of Dollars) Plant in
Service Accumulated
Depreciation CWIP Ownership %
PSCo
Electric Generation:
Hayden Unit 1 . . . . . . . . . . . . . . . . . . . . . . . . . . . . . . . . . . . . . . . . $ 98,145 $ 66,333 $ 1,405 75.5%
Hayden Unit 2 . . . . . . . . . . . . . . . . . . . . . . . . . . . . . . . . . . . . . . . . 121,571 59,999 8,867 37.4
Hayden Common Facilities . . . . . . . . . . . . . . . . . . . . . . . . . . . . . . 37,049 16,928 135 53.1
Craig Units 1 and 2 . . . . . . . . . . . . . . . . . . . . . . . . . . . . . . . . . . . . 59,860 35,573 3,013 9.7
Craig Common Facilities 1, 2 and 3 . . . . . . . . . . . . . . . . . . . . . . . 36,890 17,735 527 6.5
Comanche Unit 3 . . . . . . . . . . . . . . . . . . . . . . . . . . . . . . . . . . . . . . 883,971 81,748 64 66.7
Comanche Common Facilities. . . . . . . . . . . . . . . . . . . . . . . . . . . . 23,624 1,051 308 82.0
Electric Transmission:
Transmission and other facilities, including substations . . . . . . . . 151,301 60,847 1,730 Various
Gas Transportation:
Rifle, Colo. to Avon, Colo. . . . . . . . . . . . . . . . . . . . . . . . . . . . . . . 16,278 5,594 — 60.0
Total PSCo . . . . . . . . . . . . . . . . . . . . . . . . . . . . . . . . . . . . . . . . $ 1,428,689 $ 345,808 $ 16,049
NSP-Minnesota and PSCo have approximately 500 MW and 820 MW of jointly owned generating capacity, respectively. Each
Company’s share of operating expenses and construction expenditures are included in the applicable utility accounts. Each of the
respective owners is responsible for providing its own financing.
6. Income Taxes
Tax Increase Prevention Act of 2014 — In 2014, the Tax Increase Prevention Act (TIPA) was signed into law. The TIPA provides for
the following:
• The R&E credit was extended for 2014;
• PTCs were extended for projects that began construction before the end of 2014 with certain projects qualifying into future
years; and
• 50 percent bonus depreciation was extended one year through 2014. Additionally, some longer production period property
placed in service in 2015 is also eligible for 50 percent bonus depreciation.


