Xcel Energy 2014 Annual Report Download - page 138
Download and view the complete annual report
Please find page 138 of the 2014 Xcel Energy annual report below. You can navigate through the pages in the report by either clicking on the pages listed below, or by using the keyword search tool below to find specific information within the annual report.-
 1
1 -
2
-
3
-
4
-
5
-
6
-
7
-
8
-
9
-
10
-
11
-
12
-
13
-
14
-
15
-
16
-
17
-
18
-
19
-
20
-
21
-
22
-
23
-
24
-
25
-
26
-
27
-
28
-
29
-
30
-
31
-
32
-
33
-
34
-
35
-
36
-
37
-
38
-
39
-
40
-
41
-
42
-
43
-
44
-
45
-
46
-
47
-
48
-
49
-
50
-
51
-
52
-
53
-
54
-
55
-
56
-
57
-
58
-
59
-
60
-
61
-
62
-
63
-
64
-
65
-
66
-
67
-
68
-
69
-
70
-
71
-
72
-
73
-
74
-
75
-
76
-
77
-
78
-
79
-
80
-
81
-
82
-
83
-
84
-
85
-
86
-
87
-
88
-
89
-
90
-
91
-
92
-
93
-
94
-
95
-
96
-
97
-
98
-
99
-
100
-
101
-
102
-
103
-
104
-
105
-
106
-
107
-
108
-
109
-
110
-
111
-
112
-
113
-
114
-
115
-
116
-
117
-
118
-
119
-
120
-
121
-
122
-
123
-
124
-
125
-
126
-
127
-
 128
128 -
 129
129 -
 130
130 -
 131
131 -
 132
132 -
 133
133 -
 134
134 -
 135
135 -
 136
136 -
 137
137 -
 138
138 -
 139
139 -
 140
140 -
 141
141 -
 142
142 -
 143
143 -
 144
144 -
 145
145 -
 146
146 -
 147
147 -
 148
148 -
149
-
150
-
151
-
152
-
153
-
154
-
155
-
156
-
157
-
158
-
159
-
160
-
161
-
162
-
163
-
164
-
165
-
166
-
167
-
168
-
169
-
170
-
171
-
172
-
173
-
174
-
175
-
176
-
177
-
178
-
179
-
180
-
181
-
182
-
183
-
184
 |
 |

120
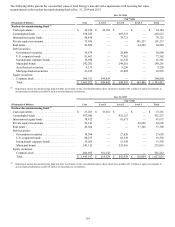
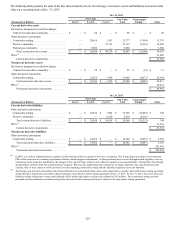
The following table presents for each of the fair value hierarchy levels, Xcel Energy’s derivative assets and liabilities measured at fair
value on a recurring basis at Dec. 31, 2013:
Dec. 31, 2013
Fair Value Fair Value
Total Counterparty
Netting (b)
(Thousands of Dollars) Level 1 Level 2 Level 3 Total
Current derivative assets
Derivatives designated as cash flow hedges:
Vehicle fuel and other commodity . . . . . . . . . . . . . . $ — $ 88 $ — $ 88 $ — $ 88
Other derivative instruments:
Commodity trading. . . . . . . . . . . . . . . . . . . . . . . . . . — 20,610 1,167 21,777 (7,994) 13,783
Electric commodity. . . . . . . . . . . . . . . . . . . . . . . . . . — — 47,112 47,112 (8,210) 38,902
Natural gas commodity. . . . . . . . . . . . . . . . . . . . . . . — 5,906 — 5,906 — 5,906
Total current derivative assets. . . . . . . . . . . . . . . . $ — $ 26,604 $ 48,279 $ 74,883 $ (16,204) 58,679
PPAs (a) . . . . . . . . . . . . . . . . . . . . . . . . . . . . . . . . . . . . 33,028
Current derivative instruments . . . . . . . . . . . . . . $ 91,707
Noncurrent derivative assets
Derivatives designated as cash flow hedges:
Vehicle fuel and other commodity . . . . . . . . . . . . . . $ — $ 29 $ — $ 29 $ (16) $ 13
Other derivative instruments:
Commodity trading. . . . . . . . . . . . . . . . . . . . . . . . . . — 32,074 3,395 35,469 (9,071) 26,398
Total noncurrent derivative assets. . . . . . . . . . . . . $ — $ 32,103 $ 3,395 $ 35,498 $ (9,087) 26,411
PPAs (a) . . . . . . . . . . . . . . . . . . . . . . . . . . . . . . . . . . . . 58,431
Noncurrent derivative instruments . . . . . . . . . . . $ 84,842
Dec. 31, 2013
Fair Value Fair Value
Total Counterparty
Netting (b)
(Thousands of Dollars) Level 1 Level 2 Level 3 Total
Current derivative liabilities
Other derivative instruments:
Commodity trading. . . . . . . . . . . . . . . . . . . . . . . . . . $ — $ 10,546 $ 1,804 $ 12,350 $ (12,002) $ 348
Electric commodity. . . . . . . . . . . . . . . . . . . . . . . . . . — — 8,210 8,210 (8,210) —
Total current derivative liabilities . . . . . . . . . . . . $ — $ 10,546 $ 10,014 $ 20,560 $ (20,212) 348
PPAs (a) . . . . . . . . . . . . . . . . . . . . . . . . . . . . . . . . . . . . 23,034
Current derivative instruments . . . . . . . . . . . . . . $ 23,382
Noncurrent derivative liabilities
Other derivative instruments:
Commodity trading. . . . . . . . . . . . . . . . . . . . . . . . . . $ — $ 14,382 $ — $ 14,382 $ (9,087) $ 5,295
Total noncurrent derivative liabilities . . . . . . . . . $ — $ 14,382 $ — $ 14,382 $ (9,087) 5,295
PPAs (a) . . . . . . . . . . . . . . . . . . . . . . . . . . . . . . . . . . . . 203,929
Noncurrent derivative instruments . . . . . . . . . . . $ 209,224
(a) In 2003, as a result of implementing new guidance on the normal purchase exception for derivative accounting, Xcel Energy began recording several long-term
PPAs at fair value due to accounting requirements related to underlying price adjustments. As these purchases are recovered through normal regulatory recovery
mechanisms in the respective jurisdictions, the changes in fair value for these contracts were offset by regulatory assets and liabilities. During 2006, Xcel Energy
qualified these contracts under the normal purchase exception. Based on this qualification, the contracts are no longer adjusted to fair value and the previous
carrying value of these contracts will be amortized over the remaining contract lives along with the offsetting regulatory assets and liabilities.
(b) Xcel Energy nets derivative instruments and related collateral in its consolidated balance sheet when supported by a legally enforceable master netting agreement,
and all derivative instruments and related collateral amounts were subject to master netting agreements at Dec. 31, 2013. At Dec. 31, 2013, derivative assets and
liabilities include obligations to return cash collateral of $0.2 million and rights to reclaim cash collateral of $4.2 million. The counterparty netting amounts
presented exclude settlement receivables and payables and non-derivative amounts that may be subject to the same master netting agreements.