Xcel Energy 2014 Annual Report Download - page 45
Download and view the complete annual report
Please find page 45 of the 2014 Xcel Energy annual report below. You can navigate through the pages in the report by either clicking on the pages listed below, or by using the keyword search tool below to find specific information within the annual report.-
 1
1 -
2
-
3
-
4
-
5
-
6
-
7
-
8
-
9
-
10
-
11
-
12
-
13
-
14
-
15
-
16
-
17
-
18
-
19
-
20
-
21
-
22
-
23
-
24
-
25
-
26
-
27
-
28
-
29
-
30
-
31
-
32
-
33
-
34
-
 35
35 -
 36
36 -
 37
37 -
 38
38 -
 39
39 -
 40
40 -
 41
41 -
 42
42 -
 43
43 -
 44
44 -
 45
45 -
 46
46 -
 47
47 -
 48
48 -
 49
49 -
 50
50 -
 51
51 -
 52
52 -
 53
53 -
 54
54 -
 55
55 -
56
-
57
-
58
-
59
-
60
-
61
-
62
-
63
-
64
-
65
-
66
-
67
-
68
-
69
-
70
-
71
-
72
-
73
-
74
-
75
-
76
-
77
-
78
-
79
-
80
-
81
-
82
-
83
-
84
-
85
-
86
-
87
-
88
-
89
-
90
-
91
-
92
-
93
-
94
-
95
-
96
-
97
-
98
-
99
-
100
-
101
-
102
-
103
-
104
-
105
-
106
-
107
-
108
-
109
-
110
-
111
-
112
-
113
-
114
-
115
-
116
-
117
-
118
-
119
-
120
-
121
-
122
-
123
-
124
-
125
-
126
-
127
-
128
-
129
-
130
-
131
-
132
-
133
-
134
-
135
-
136
-
137
-
138
-
139
-
140
-
141
-
142
-
143
-
144
-
145
-
146
-
147
-
148
-
149
-
150
-
151
-
152
-
153
-
154
-
155
-
156
-
157
-
158
-
159
-
160
-
161
-
162
-
163
-
164
-
165
-
166
-
167
-
168
-
169
-
170
-
171
-
172
-
173
-
174
-
175
-
176
-
177
-
178
-
179
-
180
-
181
-
182
-
183
-
184
 |
 |
27
NSP-Minnesota
Public Utility Regulation
Summary of Regulatory Agencies and Areas of Jurisdiction — Retail rates, services and other aspects of NSP-Minnesota’s retail
natural gas operations are regulated by the MPUC and the NDPSC within their respective states. The MPUC has regulatory authority
over security issuances, certain property transfers, mergers with other utilities and transactions between NSP-Minnesota and its
affiliates. In addition, the MPUC reviews and approves NSP-Minnesota’s natural gas supply plans for meeting customers’ future
energy needs. NSP-Minnesota is subject to the jurisdiction of the FERC with respect to certain natural gas transactions in interstate
commerce. NSP-Minnesota is subject to the DOT, the Minnesota Office of Pipeline Safety, the NDPSC and the SDPUC for pipeline
safety compliance, including pipeline facilities used in electric utility operations for fuel deliveries.
Purchased Gas and Conservation Cost-Recovery Mechanisms — NSP-Minnesota’s retail natural gas rates for Minnesota and North
Dakota include a PGA clause that provides for prospective monthly rate adjustments to reflect the forecasted cost of purchased natural
gas, transportation service and storage service. The annual difference between the natural gas cost revenues collected through PGA
rates and the actual natural gas costs is collected or refunded over the subsequent 12-month period.
NSP-Minnesota also recovers costs associated with transmission and distribution pipeline integrity management programs through its
GUIC rider. Costs recoverable under the GUIC rider include funding for pipeline assessments as well as deferred costs from NSP-
Minnesota’s existing sewer separation and pipeline integrity management programs. The MPUC and NDPSC have the authority to
disallow recovery of certain costs if they find the utility was not prudent in its procurement activities.
Minnesota state law requires utilities to invest 0.5 percent of their state natural gas revenues in CIP. These costs are recovered through
customer base rates and an annual cost-recovery mechanism for the CIP expenditures.
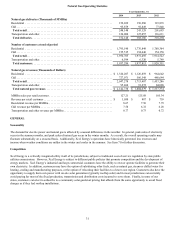
Capability and Demand
Natural gas supply requirements are categorized as firm or interruptible (customers with an alternate energy supply). The maximum
daily send-out (firm and interruptible) for NSP-Minnesota was 752,931 MMBtu, which occurred on Jan. 2, 2014 and 767,636 MMBtu,
which occurred on Jan. 21, 2013.
NSP-Minnesota purchases natural gas from independent suppliers, generally based on market indices that reflect current prices. The
natural gas is delivered under transportation agreements with interstate pipelines. These agreements provide for firm deliverable
pipeline capacity of 610,048 MMBtu per day. In addition, NSP-Minnesota contracts with providers of underground natural gas
storage services. These agreements provide storage for approximately 26 percent of winter natural gas requirements and 30 percent of
peak day firm requirements of NSP-Minnesota.
NSP-Minnesota also owns and operates one LNG plant with a storage capacity of 2.0 Bcf equivalent and three propane-air plants with
a storage capacity of 1.3 Bcf equivalent to help meet its peak requirements. These peak-shaving facilities have production capacity
equivalent to 246,000 MMBtu of natural gas per day, or approximately 30 percent of peak day firm requirements. LNG and propane-
air plants provide a cost-effective alternative to annual fixed pipeline transportation charges to meet the peaks caused by firm space
heating demand on extremely cold winter days.
NSP-Minnesota is required to file for a change in natural gas supply contract levels to meet peak demand, to redistribute demand costs
among classes, or to exchange one form of demand for another. In August 2014, the MPUC approved NSP-Minnesota’s contract
demand levels for the years 2007 through 2013. Demand levels filed with the MPUC in 2014 are awaiting approval.
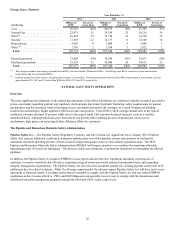
Natural Gas Supply and Costs
NSP-Minnesota actively seeks natural gas supply, transportation and storage alternatives to yield a diversified portfolio that provides
increased flexibility, decreased interruption and financial risk and economical rates. In addition, NSP-Minnesota conducts natural gas
price hedging activity that has been approved by the MPUC.
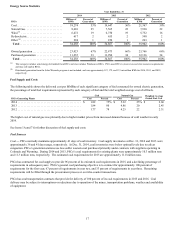
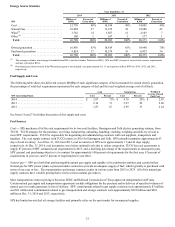
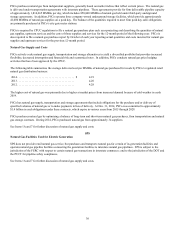
The following table summarizes the average delivered cost per MMBtu of natural gas purchased for resale by NSP-Minnesota’s
regulated retail natural gas distribution business:
2014 . . . . . . . . . . . . . . . . . . . . . . . . . . . . . . . . . . . . . . . . $ 6.17
2013 . . . . . . . . . . . . . . . . . . . . . . . . . . . . . . . . . . . . . . . . 4.53
2012 . . . . . . . . . . . . . . . . . . . . . . . . . . . . . . . . . . . . . . . . 4.41