Xcel Energy 2014 Annual Report Download - page 29
Download and view the complete annual report
Please find page 29 of the 2014 Xcel Energy annual report below. You can navigate through the pages in the report by either clicking on the pages listed below, or by using the keyword search tool below to find specific information within the annual report.-
 1
1 -
2
-
3
-
4
-
5
-
6
-
7
-
8
-
9
-
10
-
11
-
12
-
13
-
14
-
15
-
16
-
17
-
18
-
 19
19 -
 20
20 -
 21
21 -
 22
22 -
 23
23 -
 24
24 -
 25
25 -
 26
26 -
 27
27 -
 28
28 -
 29
29 -
 30
30 -
 31
31 -
 32
32 -
 33
33 -
 34
34 -
 35
35 -
 36
36 -
 37
37 -
 38
38 -
 39
39 -
40
-
41
-
42
-
43
-
44
-
45
-
46
-
47
-
48
-
49
-
50
-
51
-
52
-
53
-
54
-
55
-
56
-
57
-
58
-
59
-
60
-
61
-
62
-
63
-
64
-
65
-
66
-
67
-
68
-
69
-
70
-
71
-
72
-
73
-
74
-
75
-
76
-
77
-
78
-
79
-
80
-
81
-
82
-
83
-
84
-
85
-
86
-
87
-
88
-
89
-
90
-
91
-
92
-
93
-
94
-
95
-
96
-
97
-
98
-
99
-
100
-
101
-
102
-
103
-
104
-
105
-
106
-
107
-
108
-
109
-
110
-
111
-
112
-
113
-
114
-
115
-
116
-
117
-
118
-
119
-
120
-
121
-
122
-
123
-
124
-
125
-
126
-
127
-
128
-
129
-
130
-
131
-
132
-
133
-
134
-
135
-
136
-
137
-
138
-
139
-
140
-
141
-
142
-
143
-
144
-
145
-
146
-
147
-
148
-
149
-
150
-
151
-
152
-
153
-
154
-
155
-
156
-
157
-
158
-
159
-
160
-
161
-
162
-
163
-
164
-
165
-
166
-
167
-
168
-
169
-
170
-
171
-
172
-
173
-
174
-
175
-
176
-
177
-
178
-
179
-
180
-
181
-
182
-
183
-
184
 |
 |

11
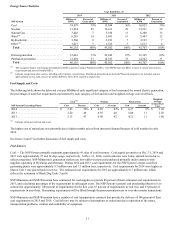
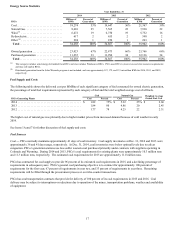
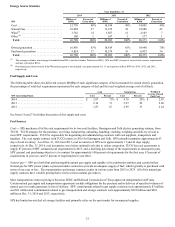
Energy Source Statistics
Year Ended Dec. 31
2014 2013 2012
NSP System Millions of
KWh Percent of
Generation Millions of
KWh Percent of
Generation Millions of
KWh Percent of
Generation
Coal. . . . . . . . . . . . . . . . . . . . . . . . . . . . . . . . 18,079 39% 15,844 36% 16,023 35%
Nuclear . . . . . . . . . . . . . . . . . . . . . . . . . . . . . 13,434 29 12,161 28 13,231 29
Natural Gas . . . . . . . . . . . . . . . . . . . . . . . . . . 3,402 7 5,550 13 6,200 13
Wind (a) . . . . . . . . . . . . . . . . . . . . . . . . . . . . . 6,243 14 5,481 13 5,443 12
Hydroelectric. . . . . . . . . . . . . . . . . . . . . . . . . 3,560 8 3,223 7 3,193 7
Other (b) . . . . . . . . . . . . . . . . . . . . . . . . . . . . . 1,417 3 1,323 3 1,617 4
Total . . . . . . . . . . . . . . . . . . . . . . . . . . . . . . 46,135 100% 43,582 100% 45,707 100%
Owned generation . . . . . . . . . . . . . . . . . . . . . 33,641 73% 29,249 67% 31,365 69%
Purchased generation . . . . . . . . . . . . . . . . . . 12,494 27 14,333 33 14,342 31
Total . . . . . . . . . . . . . . . . . . . . . . . . . . . . . . 46,135 100% 43,582 100% 45,707 100%
(a) This category includes wind energy de-bundled from RECs and also includes Windsource RECs. The NSP System uses RECs to meet or exceed state resource
requirements and may sell surplus RECs.
(b) Includes energy from other sources, including solar, biomass, oil and refuse. Distributed generation from the Solar*Rewards program is not included, and was
approximately seven, eight, and six net million KWh for 2014, 2013, and 2012, respectively.
Fuel Supply and Costs
The following table shows the delivered cost per MMBtu of each significant category of fuel consumed for owned electric generation,
the percentage of total fuel requirements represented by each category of fuel and the total weighted average cost of all fuels.
Coal (a) Nuclear Natural Gas Weighted
Average
Owned Fuel
Cost
NSP System Generating Plants Cost Percent Cost Percent Cost Percent
2014 . . . . . . . . . . . . . . . . . . . . . . . . . . . . $ 2.23 52% $ 0.89 42% $ 6.27 6% $ 1.94
2013 . . . . . . . . . . . . . . . . . . . . . . . . . . . . 2.20 49 0.95 40 5.08 11 2.03
2012 . . . . . . . . . . . . . . . . . . . . . . . . . . . . 2.13 47 0.90 42 4.21 11 1.88
(a) Includes refuse-derived fuel and wood.
The higher cost of natural gas was primarily due to higher market prices from increased demand because of cold weather in early
2014.
See Items 1A and 7 for further discussion of fuel supply and costs.
Fuel Sources
Coal — The NSP System normally maintains approximately 41 days of coal inventory. Coal supply inventories at Dec. 31, 2014 and
2013 were approximately 27 and 34 days usage, respectively. At Dec. 31, 2014, coal inventories were below optimal levels due to
railcar congestion. NSP-Minnesota’s generation stations use low-sulfur western coal purchased primarily under contracts with
suppliers operating in Wyoming and Montana. During 2014 and 2013, coal requirements for the NSP System’s major coal-fired
generating plants were approximately 9.3 million tons and 7.3 million tons, respectively. Coal requirements for 2014 were higher as
Sherco Unit 3 was placed back in service. The estimated coal requirements for 2015 are approximately 8.7 million tons, which
reflects the retirement of Black Dog Units 3 and 4.
NSP-Minnesota and NSP-Wisconsin have contracted for coal supplies to provide 88 percent of their estimated coal requirements in
2015, and a declining percentage of the requirements in subsequent years. The NSP System’s general coal purchasing objective is to
contract for approximately 100 percent of requirements for the first year, 67 percent of requirements in year two, and 33 percent of
requirements in year three. Remaining requirements will be filled through the procurement process or over-the-counter transactions.
NSP-Minnesota and NSP-Wisconsin have a number of coal transportation contracts that provide for delivery of 100 percent of their
coal requirements in 2015 and 2016. Coal delivery may be subject to interruptions or reductions due to operation of the mines,
transportation problems, weather and availability of equipment.