Xcel Energy 2014 Annual Report Download - page 139
Download and view the complete annual report
Please find page 139 of the 2014 Xcel Energy annual report below. You can navigate through the pages in the report by either clicking on the pages listed below, or by using the keyword search tool below to find specific information within the annual report.-
 1
1 -
2
-
3
-
4
-
5
-
6
-
7
-
8
-
9
-
10
-
11
-
12
-
13
-
14
-
15
-
16
-
17
-
18
-
19
-
20
-
21
-
22
-
23
-
24
-
25
-
26
-
27
-
28
-
29
-
30
-
31
-
32
-
33
-
34
-
35
-
36
-
37
-
38
-
39
-
40
-
41
-
42
-
43
-
44
-
45
-
46
-
47
-
48
-
49
-
50
-
51
-
52
-
53
-
54
-
55
-
56
-
57
-
58
-
59
-
60
-
61
-
62
-
63
-
64
-
65
-
66
-
67
-
68
-
69
-
70
-
71
-
72
-
73
-
74
-
75
-
76
-
77
-
78
-
79
-
80
-
81
-
82
-
83
-
84
-
85
-
86
-
87
-
88
-
89
-
90
-
91
-
92
-
93
-
94
-
95
-
96
-
97
-
98
-
99
-
100
-
101
-
102
-
103
-
104
-
105
-
106
-
107
-
108
-
109
-
110
-
111
-
112
-
113
-
114
-
115
-
116
-
117
-
118
-
119
-
120
-
121
-
122
-
123
-
124
-
125
-
126
-
127
-
128
-
 129
129 -
 130
130 -
 131
131 -
 132
132 -
 133
133 -
 134
134 -
 135
135 -
 136
136 -
 137
137 -
 138
138 -
 139
139 -
 140
140 -
 141
141 -
 142
142 -
 143
143 -
 144
144 -
 145
145 -
 146
146 -
 147
147 -
 148
148 -
 149
149 -
150
-
151
-
152
-
153
-
154
-
155
-
156
-
157
-
158
-
159
-
160
-
161
-
162
-
163
-
164
-
165
-
166
-
167
-
168
-
169
-
170
-
171
-
172
-
173
-
174
-
175
-
176
-
177
-
178
-
179
-
180
-
181
-
182
-
183
-
184
 |
 |

121
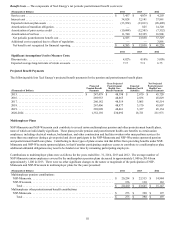
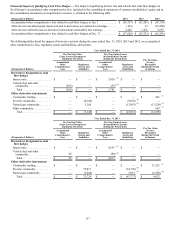
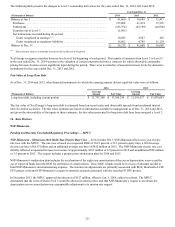
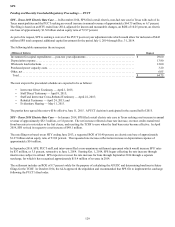
The following table presents the changes in Level 3 commodity derivatives for the years ended Dec. 31, 2014, 2013 and 2012:
Year Ended Dec. 31
(Thousands of Dollars) 2014 2013 2012
Balance at Jan. 1 . . . . . . . . . . . . . . . . . . . . . . . . . . . . . . . . . . . . . . . . . . . . . . . . . . . . . $ 41,660 $ 16,649 $ 12,417
Purchases . . . . . . . . . . . . . . . . . . . . . . . . . . . . . . . . . . . . . . . . . . . . . . . . . . . . . . . . . 135,008 61,474 37,595
Settlements . . . . . . . . . . . . . . . . . . . . . . . . . . . . . . . . . . . . . . . . . . . . . . . . . . . . . . . . (145,974)(45,199) (44,950)
Transfers out of Level 3 . . . . . . . . . . . . . . . . . . . . . . . . . . . . . . . . . . . . . . . . . . . . . . (1,093) — —
Net transactions recorded during the period:
Gains recognized in earnings (a) . . . . . . . . . . . . . . . . . . . . . . . . . . . . . . . . . . . . . . 10,692 3,947 463
Gains recognized as regulatory liabilities . . . . . . . . . . . . . . . . . . . . . . . . . . . . . . 15,862 4,789 11,124
Balance at Dec. 31 . . . . . . . . . . . . . . . . . . . . . . . . . . . . . . . . . . . . . . . . . . . . . . . . . . . $ 56,155 $ 41,660 $ 16,649
(a) These amounts relate to commodity derivatives held at the end of the period.
Xcel Energy recognizes transfers between levels as of the beginning of each period. The transfer of amounts from Level 3 to Level 2
in the year ended Dec. 31, 2014 was due to the valuation of certain long-term derivative contracts for which observable commodity
pricing forecasts became a more significant input during the period. There were no transfers of amounts between levels for derivative
instruments for the years ended Dec. 31, 2013 and 2012.
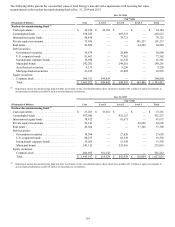
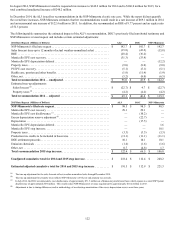
Fair Value of Long-Term Debt
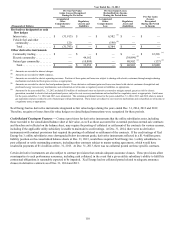
As of Dec. 31, 2014 and 2013, other financial instruments for which the carrying amount did not equal fair value were as follows:
2014 2013
(Thousands of Dollars) Carrying
Amount Fair Value Carrying
Amount Fair Value
Long-term debt, including current portion . . . . . . . . . . . . . . . . . . $ 11,757,360 $ 13,360,236 $ 11,191,517 $ 11,878,643
The fair value of Xcel Energy’s long-term debt is estimated based on recent trades and observable spreads from benchmark interest
rates for similar securities. The fair value estimates are based on information available to management as of Dec. 31, 2014 and 2013,
and given the observability of the inputs to these estimates, the fair values presented for long-term debt have been assigned a Level 2.
12. Rate Matters
NSP-Minnesota
Pending and Recently Concluded Regulatory Proceedings — MPUC
NSP-Minnesota – Minnesota 2014 Multi-Year Electric Rate Case — In November 2013, NSP-Minnesota filed a two-year electric
rate case with the MPUC. The rate case is based on a requested ROE of 10.25 percent, a 52.5 percent equity ratio, a 2014 average
electric rate base of $6.67 billion and an additional average rate base of $412 million in 2015. The NSP-Minnesota electric rate case
initially reflected a requested increase in revenues of approximately $193 million or 6.9 percent in 2014 and an additional $98 million
or 3.5 percent in 2015. The request includes a proposed rate moderation plan for 2014 and 2015.
NSP-Minnesota’s moderation plan includes the acceleration of the eight-year amortization of the excess depreciation reserve and the
use of expected funds from the DOE for settlement of certain claims. These DOE refunds would be in excess of amounts needed to
fund NSP-Minnesota’s decommissioning expense. The interim rate adjustments are primarily associated with ROE, Monticello LCM/
EPU project costs and NSP-Minnesota’s request to amortize amounts associated with the canceled PI EPU project.
In December 2013, the MPUC approved interim rates of $127 million, effective Jan. 3, 2014, subject to refund. The MPUC
determined that the costs of Sherco Unit 3 would be allowed in interim rates, and that NSP-Minnesota’s request to accelerate the
depreciation reserve amortization was a permissible adjustment to its interim rate request.