Xcel Energy 2014 Annual Report Download - page 117
Download and view the complete annual report
Please find page 117 of the 2014 Xcel Energy annual report below. You can navigate through the pages in the report by either clicking on the pages listed below, or by using the keyword search tool below to find specific information within the annual report.-
 1
1 -
2
-
3
-
4
-
5
-
6
-
7
-
8
-
9
-
10
-
11
-
12
-
13
-
14
-
15
-
16
-
17
-
18
-
19
-
20
-
21
-
22
-
23
-
24
-
25
-
26
-
27
-
28
-
29
-
30
-
31
-
32
-
33
-
34
-
35
-
36
-
37
-
38
-
39
-
40
-
41
-
42
-
43
-
44
-
45
-
46
-
47
-
48
-
49
-
50
-
51
-
52
-
53
-
54
-
55
-
56
-
57
-
58
-
59
-
60
-
61
-
62
-
63
-
64
-
65
-
66
-
67
-
68
-
69
-
70
-
71
-
72
-
73
-
74
-
75
-
76
-
77
-
78
-
79
-
80
-
81
-
82
-
83
-
84
-
85
-
86
-
87
-
88
-
89
-
90
-
91
-
92
-
93
-
94
-
95
-
96
-
97
-
98
-
99
-
100
-
101
-
102
-
103
-
104
-
105
-
106
-
 107
107 -
 108
108 -
 109
109 -
 110
110 -
 111
111 -
 112
112 -
 113
113 -
 114
114 -
 115
115 -
 116
116 -
 117
117 -
 118
118 -
 119
119 -
 120
120 -
 121
121 -
 122
122 -
 123
123 -
 124
124 -
 125
125 -
 126
126 -
 127
127 -
128
-
129
-
130
-
131
-
132
-
133
-
134
-
135
-
136
-
137
-
138
-
139
-
140
-
141
-
142
-
143
-
144
-
145
-
146
-
147
-
148
-
149
-
150
-
151
-
152
-
153
-
154
-
155
-
156
-
157
-
158
-
159
-
160
-
161
-
162
-
163
-
164
-
165
-
166
-
167
-
168
-
169
-
170
-
171
-
172
-
173
-
174
-
175
-
176
-
177
-
178
-
179
-
180
-
181
-
182
-
183
-
184
 |
 |

99
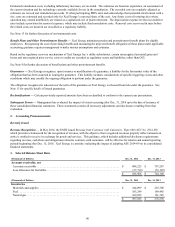
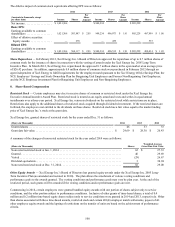
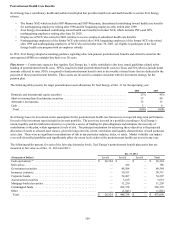
The components of Xcel Energy’s net deferred tax liability (current and noncurrent) at Dec. 31 were as follows:
(Thousands of Dollars) 2014 2013
Deferred tax liabilities:
Differences between book and tax bases of property . . . . . . . . . . . . . . . . . . . . . . . . . . . . . . . . . . . . . . . . $ 6,257,191 $ 5,562,446
Regulatory assets. . . . . . . . . . . . . . . . . . . . . . . . . . . . . . . . . . . . . . . . . . . . . . . . . . . . . . . . . . . . . . . . . . . . 300,762 321,636
Other . . . . . . . . . . . . . . . . . . . . . . . . . . . . . . . . . . . . . . . . . . . . . . . . . . . . . . . . . . . . . . . . . . . . . . . . . . . . . 300,251 254,639
Total deferred tax liabilities . . . . . . . . . . . . . . . . . . . . . . . . . . . . . . . . . . . . . . . . . . . . . . . . . . . . . . . . . $ 6,858,204 $ 6,138,721
Deferred tax assets:
NOL carryforward. . . . . . . . . . . . . . . . . . . . . . . . . . . . . . . . . . . . . . . . . . . . . . . . . . . . . . . . . . . . . . . . . . . $ 552,274 $ 532,774
Tax credit carryforward. . . . . . . . . . . . . . . . . . . . . . . . . . . . . . . . . . . . . . . . . . . . . . . . . . . . . . . . . . . . . . . 346,064 311,388
Rate refund . . . . . . . . . . . . . . . . . . . . . . . . . . . . . . . . . . . . . . . . . . . . . . . . . . . . . . . . . . . . . . . . . . . . . . . . 93,956 49,804
Unbilled revenue - fuel costs. . . . . . . . . . . . . . . . . . . . . . . . . . . . . . . . . . . . . . . . . . . . . . . . . . . . . . . . . . . 55,021 58,908
Regulatory liabilities . . . . . . . . . . . . . . . . . . . . . . . . . . . . . . . . . . . . . . . . . . . . . . . . . . . . . . . . . . . . . . . . . 49,712 40,947
Environmental remediation . . . . . . . . . . . . . . . . . . . . . . . . . . . . . . . . . . . . . . . . . . . . . . . . . . . . . . . . . . . . 42,716 42,886
Deferred investment tax credits. . . . . . . . . . . . . . . . . . . . . . . . . . . . . . . . . . . . . . . . . . . . . . . . . . . . . . . . . 31,886 34,231
NOL and tax credit valuation allowances . . . . . . . . . . . . . . . . . . . . . . . . . . . . . . . . . . . . . . . . . . . . . . . . . (3,402) (3,263)
Other . . . . . . . . . . . . . . . . . . . . . . . . . . . . . . . . . . . . . . . . . . . . . . . . . . . . . . . . . . . . . . . . . . . . . . . . . . . . . 83,199 81,202
Total deferred tax assets . . . . . . . . . . . . . . . . . . . . . . . . . . . . . . . . . . . . . . . . . . . . . . . . . . . . . . . . . . . . $ 1,251,426 $ 1,148,877
Net deferred tax liability . . . . . . . . . . . . . . . . . . . . . . . . . . . . . . . . . . . . . . . . . . . . . . . . . . . . . . . . . . . . . . . $ 5,606,778 $ 4,989,844
7. Earnings Per Share
Basic EPS was computed by dividing the earnings available to Xcel Energy Inc.’s common shareholders by the weighted average
number of common shares outstanding during the period. Diluted EPS was computed by dividing the earnings available to Xcel
Energy Inc.’s common shareholders by the diluted weighted average number of common shares outstanding during the period.
Diluted EPS reflects the potential dilution that could occur if securities or other agreements to issue common stock (i.e., common
stock equivalents) were settled. The weighted average number of potentially dilutive shares outstanding used to calculate Xcel Energy
Inc.’s diluted EPS is calculated using the treasury stock method.
Common Stock Equivalents — Xcel Energy Inc. currently has common stock equivalents related to certain equity awards in share-
based compensation arrangements.
Common stock equivalents causing a dilutive impact to EPS include commitments to issue common stock related to time based equity
compensation awards and time based employer matching contributions to certain 401(k) plan participants. In October 2013, Xcel
Energy determined that it would settle 401(k) employer matching contributions in cash instead of common stock going forward for
substantially all of its employees. Share-based compensation accounting for the impacted employee groups ceased in October 2013,
and corresponding expense amounts recorded to equity were reclassified to a liability for expected cash settlements.
Stock equivalent units granted to Xcel Energy Inc.’s Board of Directors are included in common shares outstanding upon grant date as
there is no further service, performance or market condition associated with these awards. Restricted stock, granted to settle amounts
due to certain employees under the Xcel Energy Inc. Executive Annual Incentive Award Plan, is included in common shares
outstanding when granted.
Share-based compensation arrangements for which there is currently no dilutive impact to EPS include the following:
• Equity awards subject to a performance condition; included in common shares outstanding when all necessary conditions for
settlement have been satisfied by the end of the reporting period.
• Liability awards subject to a performance condition; any portions settled in shares are included in common shares
outstanding upon settlement.