Xcel Energy 2014 Annual Report Download - page 81
Download and view the complete annual report
Please find page 81 of the 2014 Xcel Energy annual report below. You can navigate through the pages in the report by either clicking on the pages listed below, or by using the keyword search tool below to find specific information within the annual report.-
 1
1 -
2
-
3
-
4
-
5
-
6
-
7
-
8
-
9
-
10
-
11
-
12
-
13
-
14
-
15
-
16
-
17
-
18
-
19
-
20
-
21
-
22
-
23
-
24
-
25
-
26
-
27
-
28
-
29
-
30
-
31
-
32
-
33
-
34
-
35
-
36
-
37
-
38
-
39
-
40
-
41
-
42
-
43
-
44
-
45
-
46
-
47
-
48
-
49
-
50
-
51
-
52
-
53
-
54
-
55
-
56
-
57
-
58
-
59
-
60
-
61
-
62
-
63
-
64
-
65
-
66
-
67
-
68
-
69
-
70
-
 71
71 -
 72
72 -
 73
73 -
 74
74 -
 75
75 -
 76
76 -
 77
77 -
 78
78 -
 79
79 -
 80
80 -
 81
81 -
 82
82 -
 83
83 -
 84
84 -
 85
85 -
 86
86 -
 87
87 -
 88
88 -
 89
89 -
 90
90 -
 91
91 -
92
-
93
-
94
-
95
-
96
-
97
-
98
-
99
-
100
-
101
-
102
-
103
-
104
-
105
-
106
-
107
-
108
-
109
-
110
-
111
-
112
-
113
-
114
-
115
-
116
-
117
-
118
-
119
-
120
-
121
-
122
-
123
-
124
-
125
-
126
-
127
-
128
-
129
-
130
-
131
-
132
-
133
-
134
-
135
-
136
-
137
-
138
-
139
-
140
-
141
-
142
-
143
-
144
-
145
-
146
-
147
-
148
-
149
-
150
-
151
-
152
-
153
-
154
-
155
-
156
-
157
-
158
-
159
-
160
-
161
-
162
-
163
-
164
-
165
-
166
-
167
-
168
-
169
-
170
-
171
-
172
-
173
-
174
-
175
-
176
-
177
-
178
-
179
-
180
-
181
-
182
-
183
-
184
 |
 |
63
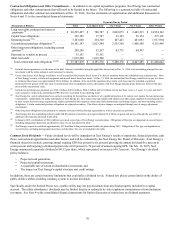
Pension costs are expected to increase in 2015 and decline in the following few years. Funding requirements are expected to decrease
in 2015 and then be flat in the following years. While investment returns exceeded the assumed levels in 2012 and again in 2014,
investment returns were slightly below the assumed levels in 2013. The pension cost calculation uses a market-related valuation of
pension assets. Xcel Energy uses a calculated value method to determine the market-related value of the plan assets. The market-
related value is determined by adjusting the fair market value of assets at the beginning of the year to reflect the investment gains and
losses (the difference between the actual investment return and the expected investment return on the market-related value) during
each of the previous five years at the rate of 20 percent per year. As these differences between the actual investment returns and the
expected investment returns are incorporated into the market-related value, the differences are recognized in pension cost over the
expected average remaining years of service for active employees which was approximately 11 years in 2014.
Based on current assumptions and the recognition of past investment gains and losses, Xcel Energy currently projects the pension
costs recognized for financial reporting purposes will be $140.4 million in 2015 and $129.6 million in 2016, while the actual pension
costs were $126.5 million in 2014 and $151.8 million in 2013. The expected increase in the 2015 cost is due primarily to the impact
of a potential settlement in the most recent Colorado electric rate case, updating the mortality tables and a decrease in the discount rate
which were offset by the reduced amortization of prior service costs and other historic loss amounts, including the 2008 market loss.
Further, future year costs are expected to decrease primarily as a result of reductions in loss amortizations and an increase in expected
return on assets as a result of increases in assets via planned contributions and the subsequent expected return of current assets.
In 2014, the Society of Actuaries published a new mortality table and projection scale that increased the overall life expectancy of
males and females. Xcel Energy has reviewed its own population through a credibility analysis and adopted the RP 2014 table with
modifications based on our population and specific experience.
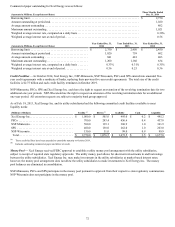
At Dec. 31, 2014, Xcel Energy set the rate of return on assets used to measure pension costs at 7.09 percent, which is a four basis point
increase from Dec. 31, 2013. The rate of return used to measure postretirement health care costs is 5.80 percent at Dec. 31, 2014 and
is a 137 basis point decrease from Dec. 31, 2013. Xcel Energy’s ongoing investment strategy is based on plan-specific investment
recommendations that seek to minimize potential investment and interest rate risk as a plan’s funded status increases over time. The
investment recommendations result in a greater percentage of long-duration fixed income securities being allocated to specific plans
having relatively higher funded status ratios and a greater percentage of growth assets being allocated to plans having relatively lower
funded status ratios.
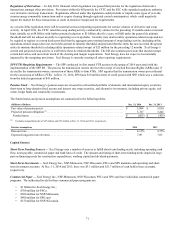
Xcel Energy set the discount rates used to value the Dec. 31, 2014 pension and postretirement health care obligations at 4.11 percent
and 4.08 percent, which represent a 64 basis point and 74 basis point decrease from Dec. 31, 2013, respectively. Xcel Energy uses a
bond matching study as its primary basis for determining the discount rate used to value pension and postretirement health care
obligations. The bond matching study utilizes a portfolio of high grade (Aa or higher) bonds that matches the expected cash flows of
Xcel Energy’s benefit plans in amount and duration. The effective yield on this cash flow matched bond portfolio determines the
discount rate for the individual plans. The bond matching study is validated for reasonableness against the Citigroup Pension Liability
Discount Curve and the Citigroup Above Median Curve. At Dec. 31, 2014, these reference points supported the selected rate. In
addition to these reference points, Xcel Energy also reviews general actuarial survey data to assess the reasonableness of the discount
rate selected.
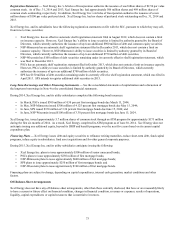
The following are the pension funding contributions across all four of Xcel Energy’s pension plans, both voluntary and required, for
2012 through 2015:
• $90.0 million in January 2015;
• $130.6 million in 2014;
• $192.4 million in 2013; and
• $198.1 million in 2012.
For future years, we anticipate contributions will be made as necessary. These contributions are summarized in Note 9 to the
consolidated financial statements. Future year amounts are estimates and may change based on actual market performance, changes in
interest rates and any changes in governmental regulations. Therefore, additional contributions could be required in the future.