Xcel Energy 2014 Annual Report Download - page 71
Download and view the complete annual report
Please find page 71 of the 2014 Xcel Energy annual report below. You can navigate through the pages in the report by either clicking on the pages listed below, or by using the keyword search tool below to find specific information within the annual report.-
 1
1 -
2
-
3
-
4
-
5
-
6
-
7
-
8
-
9
-
10
-
11
-
12
-
13
-
14
-
15
-
16
-
17
-
18
-
19
-
20
-
21
-
22
-
23
-
24
-
25
-
26
-
27
-
28
-
29
-
30
-
31
-
32
-
33
-
34
-
35
-
36
-
37
-
38
-
39
-
40
-
41
-
42
-
43
-
44
-
45
-
46
-
47
-
48
-
49
-
50
-
51
-
52
-
53
-
54
-
55
-
56
-
57
-
58
-
59
-
60
-
 61
61 -
 62
62 -
 63
63 -
 64
64 -
 65
65 -
 66
66 -
 67
67 -
 68
68 -
 69
69 -
 70
70 -
 71
71 -
 72
72 -
 73
73 -
 74
74 -
 75
75 -
 76
76 -
 77
77 -
 78
78 -
 79
79 -
 80
80 -
 81
81 -
82
-
83
-
84
-
85
-
86
-
87
-
88
-
89
-
90
-
91
-
92
-
93
-
94
-
95
-
96
-
97
-
98
-
99
-
100
-
101
-
102
-
103
-
104
-
105
-
106
-
107
-
108
-
109
-
110
-
111
-
112
-
113
-
114
-
115
-
116
-
117
-
118
-
119
-
120
-
121
-
122
-
123
-
124
-
125
-
126
-
127
-
128
-
129
-
130
-
131
-
132
-
133
-
134
-
135
-
136
-
137
-
138
-
139
-
140
-
141
-
142
-
143
-
144
-
145
-
146
-
147
-
148
-
149
-
150
-
151
-
152
-
153
-
154
-
155
-
156
-
157
-
158
-
159
-
160
-
161
-
162
-
163
-
164
-
165
-
166
-
167
-
168
-
169
-
170
-
171
-
172
-
173
-
174
-
175
-
176
-
177
-
178
-
179
-
180
-
181
-
182
-
183
-
184
 |
 |

53
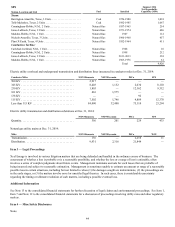
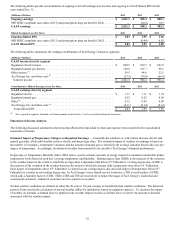
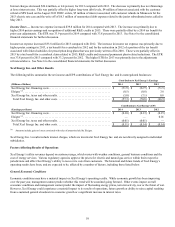
The percentage increase (decrease) in normal and actual HDD, CDD and THI are provided in the following table:
2014 vs.
Normal 2013 vs.
Normal 2014 vs.
2013 2012 vs.
Normal 2013 vs.
2012
HDD . . . . . . . . . . . . . . . . . . . . . . . . . . . . . . . . . . . . . . . . . . . 7.8% 6.5% 0.4% (15.9)% 25.8%
CDD . . . . . . . . . . . . . . . . . . . . . . . . . . . . . . . . . . . . . . . . . . . (2.6) 24.7 (20.3) 46.1 (13.6)
THI . . . . . . . . . . . . . . . . . . . . . . . . . . . . . . . . . . . . . . . . . . . . (11.9) 21.8 (24.2) 36.1 (9.7)
Weather — The following table summarizes the estimated impact of temperature variations on EPS compared with sales under normal
weather conditions:
2014 vs.
Normal 2013 vs.
Normal 2014 vs.
2013 2012 vs.
Normal 2013 vs.
2012
Retail electric . . . . . . . . . . . . . . . . . . . . . . . . . . . . . . . . . . . . $ 0.010 $ 0.088 $ (0.078) $ 0.081 $ 0.007
Firm natural gas . . . . . . . . . . . . . . . . . . . . . . . . . . . . . . . . . . 0.019 0.021 (0.002)(0.033) 0.054
Total . . . . . . . . . . . . . . . . . . . . . . . . . . . . . . . . . . . . . . . . . . $ 0.029 $ 0.109 $ (0.080) $ 0.048 $ 0.061
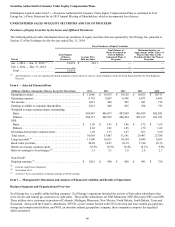
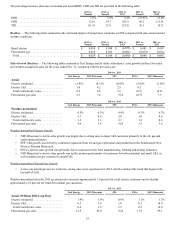
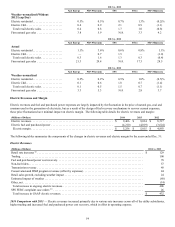
Sales Growth (Decline) — The following tables summarize Xcel Energy and its utility subsidiaries’ sales growth (decline) for actual
and weather-normalized sales for the years ended Dec. 31, compared with the previous year:
2014 vs. 2013
Xcel Energy NSP-Wisconsin SPS PSCo NSP-Minnesota
Actual
Electric residential. . . . . . . . . . . . . . . . . . . . . (1.8)% (0.3)% (0.4)% (2.8)% (1.6)%
Electric C&I. . . . . . . . . . . . . . . . . . . . . . . . . . 1.0 4.2 2.5 0.3 —
Total retail electric sales . . . . . . . . . . . . . . . 0.2 2.8 1.8 (0.7) (0.5)
Firm natural gas sales . . . . . . . . . . . . . . . . . . 2.3 7.4 N/A (0.7) 7.3
2014 vs. 2013
Xcel Energy NSP-Wisconsin SPS PSCo NSP-Minnesota
Weather-normalized
Electric residential. . . . . . . . . . . . . . . . . . . . . 0.5% 0.5% 0.4% 0.3% 0.7%
Electric C&I. . . . . . . . . . . . . . . . . . . . . . . . . . 1.7 4.4 2.8 1.6 0.6
Total retail electric sales . . . . . . . . . . . . . . . 1.3 3.3 2.3 1.2 0.6
Firm natural gas sales . . . . . . . . . . . . . . . . . . 4.6 3.8 N/A 5.2 3.6
Weather-normalized Electric Growth
• NSP-Wisconsin’s electric sales growth was largely due to strong sales to large C&I customers primarily in the oil, gas and
sand mining industries.
• SPS’ C&I growth was driven by continued expansion from oil and gas exploration and production in the Southeastern New
Mexico, Permian Basin area.
• PSCo’s electric sales growth was primarily due to customers in the food manufacturing, fracking and mining industries.
• NSP-Minnesota’s electric sales growth was led by an increased number of customers for both residential and small C&I, as
well as higher use per customer in small C&I.
Weather-normalized Natural Gas Growth
• Across our natural gas service territories, strong sales were experienced in 2014, which continued the trend that began in the
last half of 2013.
Weather-normalized sales for 2015 are projected to increase approximately 1.0 percent for retail electric customers and to decline
approximately 2.0 percent for retail firm natural gas customers.
2013 vs. 2012
Xcel Energy NSP-Wisconsin SPS PSCo NSP-Minnesota
Actual (Without 2012 Leap Day)
Electric residential. . . . . . . . . . . . . . . . . . . . . 1.4% 3.9% 0.9% 1.1% 1.3%
Electric C&I. . . . . . . . . . . . . . . . . . . . . . . . . . 0.3 1.0 1.8 0.3 (0.7)
Total retail electric sales . . . . . . . . . . . . . . . 0.6 1.9 1.5 0.5 (0.1)
Firm natural gas sales . . . . . . . . . . . . . . . . . . 21.9 30.0 N/A 17.8 29.1