Xcel Energy 2014 Annual Report Download - page 63
Download and view the complete annual report
Please find page 63 of the 2014 Xcel Energy annual report below. You can navigate through the pages in the report by either clicking on the pages listed below, or by using the keyword search tool below to find specific information within the annual report.-
 1
1 -
2
-
3
-
4
-
5
-
6
-
7
-
8
-
9
-
10
-
11
-
12
-
13
-
14
-
15
-
16
-
17
-
18
-
19
-
20
-
21
-
22
-
23
-
24
-
25
-
26
-
27
-
28
-
29
-
30
-
31
-
32
-
33
-
34
-
35
-
36
-
37
-
38
-
39
-
40
-
41
-
42
-
43
-
44
-
45
-
46
-
47
-
48
-
49
-
50
-
51
-
52
-
 53
53 -
 54
54 -
 55
55 -
 56
56 -
 57
57 -
 58
58 -
 59
59 -
 60
60 -
 61
61 -
 62
62 -
 63
63 -
 64
64 -
 65
65 -
 66
66 -
 67
67 -
 68
68 -
 69
69 -
 70
70 -
 71
71 -
 72
72 -
 73
73 -
74
-
75
-
76
-
77
-
78
-
79
-
80
-
81
-
82
-
83
-
84
-
85
-
86
-
87
-
88
-
89
-
90
-
91
-
92
-
93
-
94
-
95
-
96
-
97
-
98
-
99
-
100
-
101
-
102
-
103
-
104
-
105
-
106
-
107
-
108
-
109
-
110
-
111
-
112
-
113
-
114
-
115
-
116
-
117
-
118
-
119
-
120
-
121
-
122
-
123
-
124
-
125
-
126
-
127
-
128
-
129
-
130
-
131
-
132
-
133
-
134
-
135
-
136
-
137
-
138
-
139
-
140
-
141
-
142
-
143
-
144
-
145
-
146
-
147
-
148
-
149
-
150
-
151
-
152
-
153
-
154
-
155
-
156
-
157
-
158
-
159
-
160
-
161
-
162
-
163
-
164
-
165
-
166
-
167
-
168
-
169
-
170
-
171
-
172
-
173
-
174
-
175
-
176
-
177
-
178
-
179
-
180
-
181
-
182
-
183
-
184
 |
 |
45
PART II
Item 5 — Market for Registrant’s Common Equity, Related Stockholder Matters and Issuer Purchases of Equity Securities
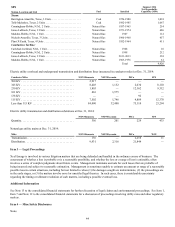
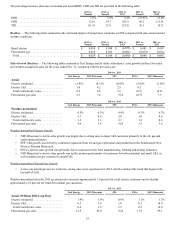
Quarterly Stock Data
Xcel Energy Inc.’s common stock is listed on the New York Stock Exchange (NYSE). The trading symbol is XEL. The number of
common shareholders of record as of Dec. 31, 2014 was approximately 67,716. The following are the high and low stock prices based
on the NYSE Composite Transactions for the quarters of 2014 and 2013 and the dividends declared per share during those quarters.
See Item 7 and Note 4 to the consolidated financial statements for further discussion of Xcel Energy Inc.’s dividend policy.
2014 High Low Dividends
First quarter . . . . . . . . . . . . . . . . . . . . . . . . . . . . . . . . . . . . . . . . . . . . . . . . . . . . . . . . . . . . . $ 30.77 $ 27.27 $ 0.3000
Second quarter. . . . . . . . . . . . . . . . . . . . . . . . . . . . . . . . . . . . . . . . . . . . . . . . . . . . . . . . . . . 32.37 29.83 0.3000
Third quarter . . . . . . . . . . . . . . . . . . . . . . . . . . . . . . . . . . . . . . . . . . . . . . . . . . . . . . . . . . . . 32.48 29.60 0.3000
Fourth quarter . . . . . . . . . . . . . . . . . . . . . . . . . . . . . . . . . . . . . . . . . . . . . . . . . . . . . . . . . . . 37.58 30.18 0.3000
2013 High Low Dividends
First quarter . . . . . . . . . . . . . . . . . . . . . . . . . . . . . . . . . . . . . . . . . . . . . . . . . . . . . . . . . . . . . $ 29.74 $ 26.77 $ 0.2700
Second quarter. . . . . . . . . . . . . . . . . . . . . . . . . . . . . . . . . . . . . . . . . . . . . . . . . . . . . . . . . . . 31.79 27.38 0.2800
Third quarter . . . . . . . . . . . . . . . . . . . . . . . . . . . . . . . . . . . . . . . . . . . . . . . . . . . . . . . . . . . . 30.41 26.90 0.2800
Fourth quarter . . . . . . . . . . . . . . . . . . . . . . . . . . . . . . . . . . . . . . . . . . . . . . . . . . . . . . . . . . . 29.40 27.14 0.2800
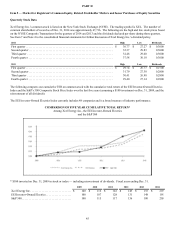
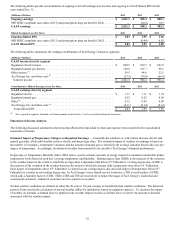
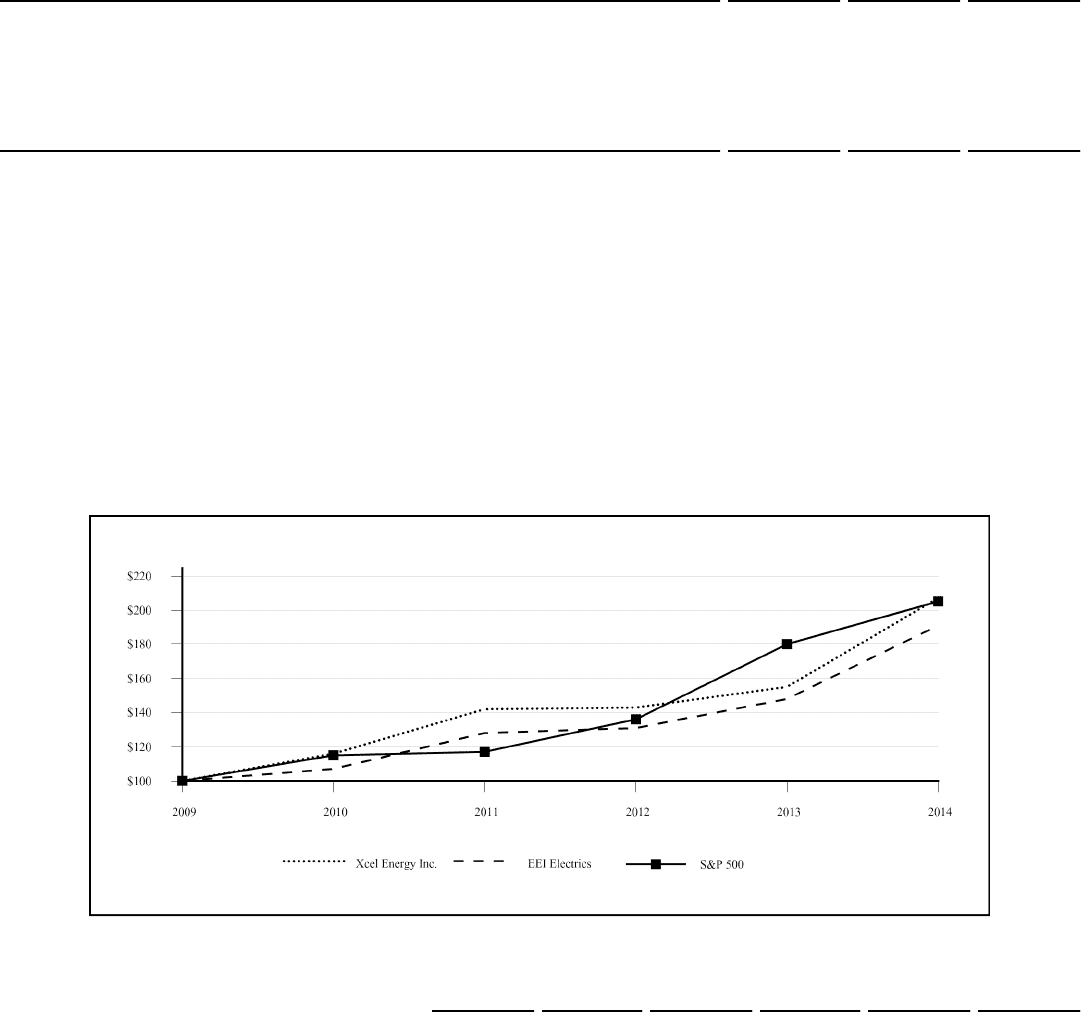
The following compares our cumulative TSR on common stock with the cumulative total return of the EEI Investor-Owned Electrics
Index and the S&P’s 500 Composite Stock Price Index over the last five years (assuming a $100 investment on Dec. 31, 2009, and the
reinvestment of all dividends).
The EEI Investor-Owned Electrics Index currently includes 48 companies and is a broad measure of industry performance.
COMPARISON OF FIVE YEAR CUMULATIVE TOTAL RETURN*
Among Xcel Energy Inc., the EEI Investor-Owned Electrics
and the S&P 500
* $100 invested on Dec. 31, 2009 in stock or index — including reinvestment of dividends. Fiscal years ending Dec. 31.
2009 2010 2011 2012 2013 2014
Xcel Energy Inc. . . . . . . . . . . . . . . . . . . . . . . . . . . . . $ 100 $ 116 $ 142 $ 143 $ 155 $ 207
EEI Investor-Owned Electrics . . . . . . . . . . . . . . . . . . 100 107 128 131 148 191
S&P 500. . . . . . . . . . . . . . . . . . . . . . . . . . . . . . . . . . . 100 115 117 136 180 205