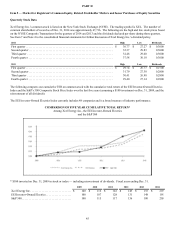
Xcel Energy 2014 Annual Report Download - page 67
Download and view the complete annual report
Please find page 67 of the 2014 Xcel Energy annual report below. You can navigate through the pages in the report by either clicking on the pages listed below, or by using the keyword search tool below to find specific information within the annual report.-
 1
1 -
2
-
3
-
4
-
5
-
6
-
7
-
8
-
9
-
10
-
11
-
12
-
13
-
14
-
15
-
16
-
17
-
18
-
19
-
20
-
21
-
22
-
23
-
24
-
25
-
26
-
27
-
28
-
29
-
30
-
31
-
32
-
33
-
34
-
35
-
36
-
37
-
38
-
39
-
40
-
41
-
42
-
43
-
44
-
45
-
46
-
47
-
48
-
49
-
50
-
51
-
52
-
53
-
54
-
55
-
56
-
 57
57 -
 58
58 -
 59
59 -
 60
60 -
 61
61 -
 62
62 -
 63
63 -
 64
64 -
 65
65 -
 66
66 -
 67
67 -
 68
68 -
 69
69 -
 70
70 -
 71
71 -
 72
72 -
 73
73 -
 74
74 -
 75
75 -
 76
76 -
 77
77 -
78
-
79
-
80
-
81
-
82
-
83
-
84
-
85
-
86
-
87
-
88
-
89
-
90
-
91
-
92
-
93
-
94
-
95
-
96
-
97
-
98
-
99
-
100
-
101
-
102
-
103
-
104
-
105
-
106
-
107
-
108
-
109
-
110
-
111
-
112
-
113
-
114
-
115
-
116
-
117
-
118
-
119
-
120
-
121
-
122
-
123
-
124
-
125
-
126
-
127
-
128
-
129
-
130
-
131
-
132
-
133
-
134
-
135
-
136
-
137
-
138
-
139
-
140
-
141
-
142
-
143
-
144
-
145
-
146
-
147
-
148
-
149
-
150
-
151
-
152
-
153
-
154
-
155
-
156
-
157
-
158
-
159
-
160
-
161
-
162
-
163
-
164
-
165
-
166
-
167
-
168
-
169
-
170
-
171
-
172
-
173
-
174
-
175
-
176
-
177
-
178
-
179
-
180
-
181
-
182
-
183
-
184
 |
 |

49
The only common equity securities that are publicly traded are common shares of Xcel Energy Inc. The diluted earnings and EPS of
each subsidiary as well as the ROE of each subsidiary discussed below do not represent a direct legal interest in the assets and
liabilities allocated to such subsidiary but rather represent a direct interest in our assets and liabilities as a whole. Ongoing diluted
EPS and ongoing ROE for Xcel Energy and by subsidiary are financial measures not recognized under GAAP. Ongoing diluted EPS
is calculated by dividing the net income or loss attributable to the controlling interest of each subsidiary, adjusted for certain
nonrecurring items, by the weighted average fully diluted Xcel Energy Inc. common shares outstanding for the period. Ongoing ROE
is calculated by dividing the net income or loss attributable to the controlling interest of Xcel Energy or each subsidiary, adjusted for
certain nonrecurring items, by each entity’s average common stockholders’ or stockholder’s equity. We use these non-GAAP financial
measures to evaluate and provide details of earnings results. We believe these measurements are useful to investors to evaluate the
actual and projected financial performance and contribution of our subsidiaries. These non-GAAP financial measures should not be
considered as alternatives to measures calculated and reported in accordance with GAAP.
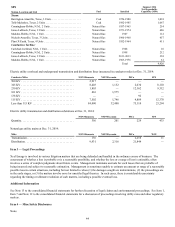
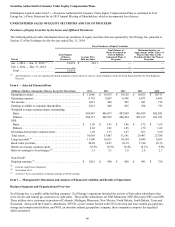
Results of Operations
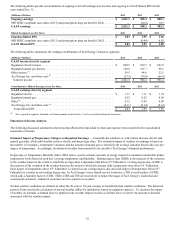
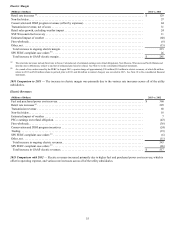
The following table summarizes the diluted EPS for Xcel Energy:
Diluted Earnings (Loss) Per Share 2014 2013 2012
PSCo. . . . . . . . . . . . . . . . . . . . . . . . . . . . . . . . . . . . . . . . . . . . . . . . . . . . . . . . . . . . . . . . . . . $ 0.90 $ 0.91 $ 0.90
NSP-Minnesota . . . . . . . . . . . . . . . . . . . . . . . . . . . . . . . . . . . . . . . . . . . . . . . . . . . . . . . . . . 0.80 0.79 0.70
SPS . . . . . . . . . . . . . . . . . . . . . . . . . . . . . . . . . . . . . . . . . . . . . . . . . . . . . . . . . . . . . . . . . . . . 0.26 0.23 0.22
NSP-Wisconsin. . . . . . . . . . . . . . . . . . . . . . . . . . . . . . . . . . . . . . . . . . . . . . . . . . . . . . . . . . . 0.14 0.12 0.10
Equity earnings of unconsolidated subsidiaries . . . . . . . . . . . . . . . . . . . . . . . . . . . . . . . . . . 0.04 0.04 0.04
Regulated utility. . . . . . . . . . . . . . . . . . . . . . . . . . . . . . . . . . . . . . . . . . . . . . . . . . . . . . . . . . 2.14 2.09 1.96
Xcel Energy Inc. and other. . . . . . . . . . . . . . . . . . . . . . . . . . . . . . . . . . . . . . . . . . . . . . . . . . (0.11)(0.14) (0.14)
Ongoing diluted EPS . . . . . . . . . . . . . . . . . . . . . . . . . . . . . . . . . . . . . . . . . . . . . . . . . . . . . 2.03 1.95 1.82
SPS FERC complaint case orders . . . . . . . . . . . . . . . . . . . . . . . . . . . . . . . . . . . . . . . . . . . . — (0.04) —
Prescription drug tax benefit . . . . . . . . . . . . . . . . . . . . . . . . . . . . . . . . . . . . . . . . . . . . . . . . — — 0.03
GAAP diluted EPS . . . . . . . . . . . . . . . . . . . . . . . . . . . . . . . . . . . . . . . . . . . . . . . . . . . . . . . $ 2.03 $ 1.91 $ 1.85
Ongoing earnings exclude adjustments for certain items. For 2013, the adjustment to GAAP earnings is related to the SPS FERC
complaint case orders. For 2012, the adjustment is related to the Patient Protection and Affordable Care Act. See below under
Adjustments to GAAP Earnings and Note 12 and Note 6 to the consolidated financial statements for further discussion, respectively,
for the 2013 and 2012 adjustments.
Xcel Energy’s management believes that ongoing earnings provide a meaningful comparison of earnings results and is representative
of Xcel Energy’s fundamental core earnings power. Xcel Energy’s management uses ongoing earnings internally for financial
planning and analysis, for reporting of results to the Board of Directors, in determining whether performance targets are met for
performance-based compensation, and when communicating its earnings outlook to analysts and investors.
2013 Adjustment to GAAP Earnings
SPS FERC Orders — As a result of the orders issued in August 2013 by the FERC for a potential SPS customer refund, a pre-tax
charge of $36 million was recorded in 2013. Of this amount, approximately $30 million ($26 million revenue reduction and $4
million of interest) was attributable to periods prior to 2013 and not representative of ongoing earnings. As such, GAAP earnings
include the total after tax amount of $24.4 million and ongoing earnings exclude $20.2 million. See Note 12 to the consolidated
financial statements for further discussion.
2012 Adjustment to GAAP Earnings
Prescription drug tax benefit — In the third quarter of 2012, Xcel Energy implemented a tax strategy related to the allocation of
funding of Xcel Energy’s retiree prescription drug plan. This strategy restored a portion of the tax benefit associated with federal
subsidies for prescription drug plans that had been accrued since 2004 and was expensed in 2010. As a result, Xcel Energy recognized
approximately $17 million, or $0.03 per share, of income tax benefit. See Note 6 to the consolidated financial statements for further
discussion.