Xcel Energy 2014 Annual Report Download - page 122
Download and view the complete annual report
Please find page 122 of the 2014 Xcel Energy annual report below. You can navigate through the pages in the report by either clicking on the pages listed below, or by using the keyword search tool below to find specific information within the annual report.-
 1
1 -
2
-
3
-
4
-
5
-
6
-
7
-
8
-
9
-
10
-
11
-
12
-
13
-
14
-
15
-
16
-
17
-
18
-
19
-
20
-
21
-
22
-
23
-
24
-
25
-
26
-
27
-
28
-
29
-
30
-
31
-
32
-
33
-
34
-
35
-
36
-
37
-
38
-
39
-
40
-
41
-
42
-
43
-
44
-
45
-
46
-
47
-
48
-
49
-
50
-
51
-
52
-
53
-
54
-
55
-
56
-
57
-
58
-
59
-
60
-
61
-
62
-
63
-
64
-
65
-
66
-
67
-
68
-
69
-
70
-
71
-
72
-
73
-
74
-
75
-
76
-
77
-
78
-
79
-
80
-
81
-
82
-
83
-
84
-
85
-
86
-
87
-
88
-
89
-
90
-
91
-
92
-
93
-
94
-
95
-
96
-
97
-
98
-
99
-
100
-
101
-
102
-
103
-
104
-
105
-
106
-
107
-
108
-
109
-
110
-
111
-
 112
112 -
 113
113 -
 114
114 -
 115
115 -
 116
116 -
 117
117 -
 118
118 -
 119
119 -
 120
120 -
 121
121 -
 122
122 -
 123
123 -
 124
124 -
 125
125 -
 126
126 -
 127
127 -
 128
128 -
 129
129 -
 130
130 -
 131
131 -
 132
132 -
133
-
134
-
135
-
136
-
137
-
138
-
139
-
140
-
141
-
142
-
143
-
144
-
145
-
146
-
147
-
148
-
149
-
150
-
151
-
152
-
153
-
154
-
155
-
156
-
157
-
158
-
159
-
160
-
161
-
162
-
163
-
164
-
165
-
166
-
167
-
168
-
169
-
170
-
171
-
172
-
173
-
174
-
175
-
176
-
177
-
178
-
179
-
180
-
181
-
182
-
183
-
184
 |
 |

104
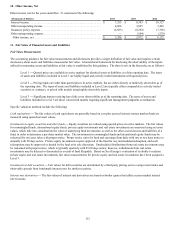
Investments in debt securities — Fair values for debt securities are determined by a third party pricing service using recent trades and
observable spreads from benchmark interest rates for similar securities.
Derivative Instruments — Fair values for foreign currency derivatives are determined using pricing models based on the prevailing
forward exchange rate of the underlying currencies. The fair values of interest rate derivatives are based on broker quotes that utilize
current market interest rate forecasts.
Pension Benefits
Xcel Energy has several noncontributory, defined benefit pension plans that cover almost all employees. Generally, benefits are based
on a combination of years of service, the employee’s average pay and, in some cases, social security benefits. Xcel Energy’s policy is
to fully fund into an external trust the actuarially determined pension costs recognized for ratemaking and financial reporting
purposes, subject to the limitations of applicable employee benefit and tax laws.
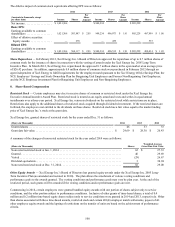
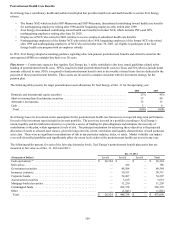
In addition to the qualified pension plans, Xcel Energy maintains a supplemental executive retirement plan (SERP) and a nonqualified
pension plan. The SERP is maintained for certain executives that were participants in the plan in 2008, when the SERP was closed to
new participants. The nonqualified pension plan provides unfunded, nonqualified benefits for compensation that is in excess of the
limits applicable to the qualified pension plans. The total obligations of the SERP and nonqualified plan as of Dec. 31, 2014 and 2013
were $46.5 million and $36.5 million, respectively. In 2014 and 2013, Xcel Energy recognized net benefit cost for financial reporting
for the SERP and nonqualified plans of $4.7 million and $6.6 million, respectively. Benefits for these unfunded plans are paid out of
Xcel Energy’s consolidated operating cash flows.
Xcel Energy bases the investment-return assumption on expected long-term performance for each of the investment types included in
its pension asset portfolio. Xcel Energy considers the historical returns achieved by its asset portfolio over the past 20-year or longer
period, as well as the long-term return levels projected and recommended by investment experts. Xcel Energy continually reviews its
pension assumptions. The pension cost determination assumes a forecasted mix of investment types over the long-term.
• Investment returns in 2014 were above the assumed level of 7.05 percent;
• Investment returns in 2013 were below the assumed level of 6.88 percent;
• Investment returns in 2012 were above the assumed level of 7.10 percent; and
• In 2015, Xcel Energy’s expected investment return assumption is 7.09 percent.
The assets are invested in a portfolio according to Xcel Energy’s return, liquidity and diversification objectives to provide a source of
funding for plan obligations and minimize the necessity of contributions to the plan, within appropriate levels of risk. The principal
mechanism for achieving these objectives is the projected allocation of assets to selected asset classes, given the long-term risk, return,
and liquidity characteristics of each particular asset class. There were no significant concentrations of risk in any particular industry,
index, or entity. Market volatility can impact even well-diversified portfolios and significantly affect the return levels achieved by
pension assets in any year.
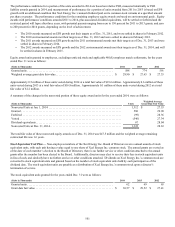
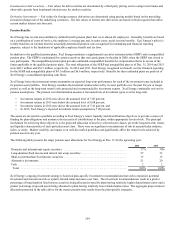
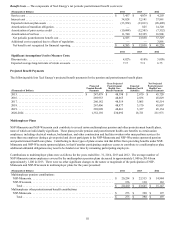
The following table presents the target pension asset allocations for Xcel Energy at Dec. 31 for the upcoming year:
2014 2013
Domestic and international equity securities . . . . . . . . . . . . . . . . . . . . . . . . . . . . . . . . . . . . . . . . . . . . . 37% 30%
Long-duration fixed income and interest rate swap securities . . . . . . . . . . . . . . . . . . . . . . . . . . . . . . . . 27 33
Short-to-intermediate fixed income securities . . . . . . . . . . . . . . . . . . . . . . . . . . . . . . . . . . . . . . . . . . . . 13 15
Alternative investments . . . . . . . . . . . . . . . . . . . . . . . . . . . . . . . . . . . . . . . . . . . . . . . . . . . . . . . . . . . . . 21 20
Cash . . . . . . . . . . . . . . . . . . . . . . . . . . . . . . . . . . . . . . . . . . . . . . . . . . . . . . . . . . . . . . . . . . . . . . . . . . . . 2 2
Total . . . . . . . . . . . . . . . . . . . . . . . . . . . . . . . . . . . . . . . . . . . . . . . . . . . . . . . . . . . . . . . . . . . . . . . . . . . 100% 100%
Xcel Energy’s ongoing investment strategy is based on plan-specific investment recommendations that seek to minimize potential
investment and interest rate risk as a plan’s funded status increases over time. The investment recommendations result in a greater
percentage of long-duration fixed income securities being allocated to specific plans having relatively higher funded status ratios and a
greater percentage of growth assets being allocated to plans having relatively lower funded status ratios. The aggregate projected asset
allocation presented in the table above for the master pension trust results from the plan-specific strategies.