Xcel Energy 2014 Annual Report Download - page 92
Download and view the complete annual report
Please find page 92 of the 2014 Xcel Energy annual report below. You can navigate through the pages in the report by either clicking on the pages listed below, or by using the keyword search tool below to find specific information within the annual report.-
 1
1 -
2
-
3
-
4
-
5
-
6
-
7
-
8
-
9
-
10
-
11
-
12
-
13
-
14
-
15
-
16
-
17
-
18
-
19
-
20
-
21
-
22
-
23
-
24
-
25
-
26
-
27
-
28
-
29
-
30
-
31
-
32
-
33
-
34
-
35
-
36
-
37
-
38
-
39
-
40
-
41
-
42
-
43
-
44
-
45
-
46
-
47
-
48
-
49
-
50
-
51
-
52
-
53
-
54
-
55
-
56
-
57
-
58
-
59
-
60
-
61
-
62
-
63
-
64
-
65
-
66
-
67
-
68
-
69
-
70
-
71
-
72
-
73
-
74
-
75
-
76
-
77
-
78
-
79
-
80
-
81
-
 82
82 -
 83
83 -
 84
84 -
 85
85 -
 86
86 -
 87
87 -
 88
88 -
 89
89 -
 90
90 -
 91
91 -
 92
92 -
 93
93 -
 94
94 -
 95
95 -
 96
96 -
 97
97 -
 98
98 -
 99
99 -
 100
100 -
 101
101 -
 102
102 -
103
-
104
-
105
-
106
-
107
-
108
-
109
-
110
-
111
-
112
-
113
-
114
-
115
-
116
-
117
-
118
-
119
-
120
-
121
-
122
-
123
-
124
-
125
-
126
-
127
-
128
-
129
-
130
-
131
-
132
-
133
-
134
-
135
-
136
-
137
-
138
-
139
-
140
-
141
-
142
-
143
-
144
-
145
-
146
-
147
-
148
-
149
-
150
-
151
-
152
-
153
-
154
-
155
-
156
-
157
-
158
-
159
-
160
-
161
-
162
-
163
-
164
-
165
-
166
-
167
-
168
-
169
-
170
-
171
-
172
-
173
-
174
-
175
-
176
-
177
-
178
-
179
-
180
-
181
-
182
-
183
-
184
 |
 |
74
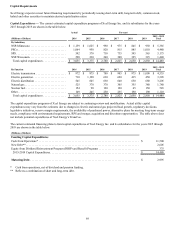
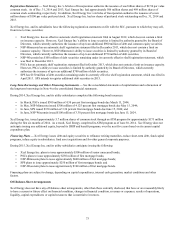
Earnings Guidance
Xcel Energy’s 2015 ongoing earnings guidance is $2.00 to $2.15 per share. Key assumptions related to 2015 earnings are detailed below:
• Constructive outcomes in all rate case and regulatory proceedings.
• If the MPUC orders a disallowance in the Monticello prudence review, Xcel Energy would exclude the associated charge from
ongoing earnings.
• Normal weather patterns are experienced for the year.
• Weather-normalized retail electric utility sales are projected to increase approximately 1.0 percent.
• Weather-normalized retail firm natural gas sales are projected to decline approximately 2.0 percent.
• Capital rider revenue is projected to increase by $160 million to $170 million over 2014 levels. The projected capital rider
revenue reflects the transfer of the CACJA project from base rates to the rider per the settlement in the Colorado electric rate
case. The settlement is pending CPUC approval.
• The change in O&M expenses is projected to be within a range of 0 percent to 2 percent from 2014 levels.
• Depreciation expense is projected to increase $160 million to $180 million over 2014 levels, reflecting the originally
proposed acceleration of the amortization of the excess depreciation reserve as part of NSP-Minnesota’s moderation plan in
the Minnesota electric rate case.
• Property taxes are projected to increase approximately $60 million to $70 million over 2014 levels.
• Interest expense (net of AFUDC — debt) is projected to increase $40 million to $50 million over 2014 levels.
• AFUDC — equity is projected to decline approximately $35 million to $45 million from 2014 levels.
• The ETR is projected to be approximately 34 percent to 36 percent.
• Average common stock and equivalents are projected to be approximately 508 million shares.
Long-Term EPS and Dividend Growth Rate Objectives
Xcel Energy expects to deliver an attractive total return to our shareholders through a combination of earnings growth and dividend
yield, based on the following long-term objectives:
• Deliver long-term annual EPS growth of 4 percent to 6 percent, based on weather-normalized, ongoing 2014 EPS of $2.00;
• Deliver annual dividend increases of 5 percent to 7 percent;
• Target a dividend payout ratio of 60 percent to 70 percent of annual ongoing EPS; and
• Maintain senior unsecured debt credit ratings in the BBB+ to A range.
Ongoing earnings is calculated using net income and adjusting for certain nonrecurring or infrequent items that are, in management’s
view, not reflective of ongoing operations.
Item 7A — Quantitative and Qualitative Disclosures About Market Risk
See Item 7, incorporated by reference.
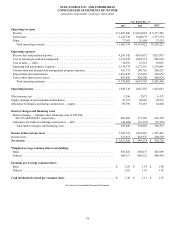
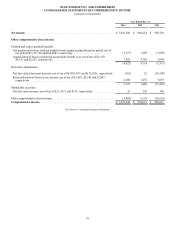
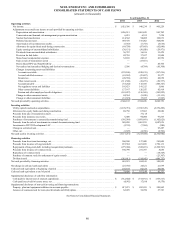
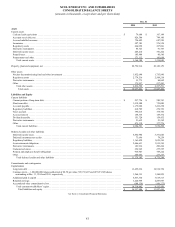
Item 8 — Financial Statements and Supplementary Data
See Item 15-1 for an index of financial statements included herein.
See Note 18 to the consolidated financial statements for summarized quarterly financial data.