Xcel Energy 2014 Annual Report Download - page 124
Download and view the complete annual report
Please find page 124 of the 2014 Xcel Energy annual report below. You can navigate through the pages in the report by either clicking on the pages listed below, or by using the keyword search tool below to find specific information within the annual report.
106
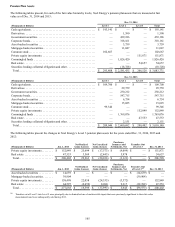
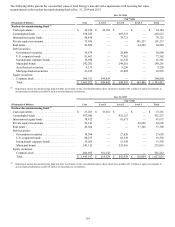
(Thousands of Dollars) Jan. 1, 2012 Net Realized
Gains (Losses) Net Unrealized
Gains (Losses)
Purchases,
Issuances and
Settlements, Net Transfers Out
of Level 3 Dec. 31, 2012
Asset-backed securities . . . . . . . . . . $ 31,368 $ 3,886 $ (5,363) $ (15,252) $ — $ 14,639
Mortgage-backed securities . . . . . . . 73,522 1,822 (2,127)(33,313) — 39,904
Private equity investments. . . . . . . . 159,363 17,537 (22,587) 4,185 — 158,498
Real estate . . . . . . . . . . . . . . . . . . . . 37,106 19 6,048 21,424 — 64,597
Total. . . . . . . . . . . . . . . . . . . . . . . . $ 301,359 $ 23,264 $ (24,029) $ (22,956) $ — $ 277,638
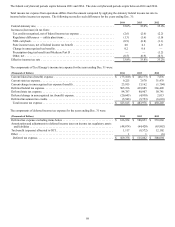
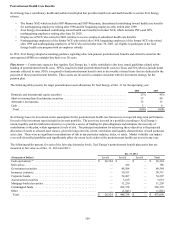
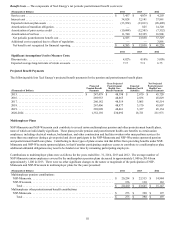
Benefit Obligations — A comparison of the actuarially computed pension benefit obligation and plan assets for Xcel Energy is
presented in the following table:
(Thousands of Dollars) 2014 2013
Accumulated Benefit Obligation at Dec. 31. . . . . . . . . . . . . . . . . . . . . . . . . . . . . . . . . . . . . . . . . . . $ 3,545,928 $ 3,282,651
Change in Projected Benefit Obligation:
Obligation at Jan. 1. . . . . . . . . . . . . . . . . . . . . . . . . . . . . . . . . . . . . . . . . . . . . . . . . . . . . . . . . . . . . . . . $ 3,440,704 $ 3,639,530
Service cost . . . . . . . . . . . . . . . . . . . . . . . . . . . . . . . . . . . . . . . . . . . . . . . . . . . . . . . . . . . . . . . . . . . . . 88,342 96,282
Interest cost . . . . . . . . . . . . . . . . . . . . . . . . . . . . . . . . . . . . . . . . . . . . . . . . . . . . . . . . . . . . . . . . . . . . . 156,619 140,690
Plan amendments . . . . . . . . . . . . . . . . . . . . . . . . . . . . . . . . . . . . . . . . . . . . . . . . . . . . . . . . . . . . . . . . . — (4,120)
Actuarial loss (gain) . . . . . . . . . . . . . . . . . . . . . . . . . . . . . . . . . . . . . . . . . . . . . . . . . . . . . . . . . . . . . . . 342,826 (153,338)
Benefit payments . . . . . . . . . . . . . . . . . . . . . . . . . . . . . . . . . . . . . . . . . . . . . . . . . . . . . . . . . . . . . . . . . (281,739) (278,340)
Obligation at Dec. 31. . . . . . . . . . . . . . . . . . . . . . . . . . . . . . . . . . . . . . . . . . . . . . . . . . . . . . . . . . . . . $ 3,746,752 $ 3,440,704
(Thousands of Dollars) 2014 2013
Change in Fair Value of Plan Assets:
Fair value of plan assets at Jan. 1. . . . . . . . . . . . . . . . . . . . . . . . . . . . . . . . . . . . . . . . . . . . . . . . . . . . . $ 3,010,140 $ 2,943,783
Actual return on plan assets . . . . . . . . . . . . . . . . . . . . . . . . . . . . . . . . . . . . . . . . . . . . . . . . . . . . . . . . . 224,808 152,259
Employer contributions . . . . . . . . . . . . . . . . . . . . . . . . . . . . . . . . . . . . . . . . . . . . . . . . . . . . . . . . . . . . 130,562 192,438
Benefit payments . . . . . . . . . . . . . . . . . . . . . . . . . . . . . . . . . . . . . . . . . . . . . . . . . . . . . . . . . . . . . . . . . (281,739) (278,340)
Fair value of plan assets at Dec. 31 . . . . . . . . . . . . . . . . . . . . . . . . . . . . . . . . . . . . . . . . . . . . . . . . . . $ 3,083,771 $ 3,010,140
(Thousands of Dollars) 2014 2013
Funded Status of Plans at Dec. 31:
Funded status (a) . . . . . . . . . . . . . . . . . . . . . . . . . . . . . . . . . . . . . . . . . . . . . . . . . . . . . . . . . . . . . . . . . . $ (662,981) $ (430,564)
(a) Amounts are recognized in noncurrent liabilities on Xcel Energy’s consolidated balance sheets.
(Thousands of Dollars) 2014 2013
Amounts Not Yet Recognized as Components of Net Periodic Benefit Cost:
Net loss. . . . . . . . . . . . . . . . . . . . . . . . . . . . . . . . . . . . . . . . . . . . . . . . . . . . . . . . . . . . . . . . . . . . . . . . . $ 1,757,935 $ 1,549,474
Prior service credit . . . . . . . . . . . . . . . . . . . . . . . . . . . . . . . . . . . . . . . . . . . . . . . . . . . . . . . . . . . . . . . . (10,878) (12,624)
Total. . . . . . . . . . . . . . . . . . . . . . . . . . . . . . . . . . . . . . . . . . . . . . . . . . . . . . . . . . . . . . . . . . . . . . . . . . $ 1,747,057 $ 1,536,850
(Thousands of Dollars) 2014 2013
Amounts Not Yet Recognized as Components of Net Periodic Benefit Cost Have Been
Recorded as Follows Based Upon Expected Recovery in Rates:
Current regulatory assets . . . . . . . . . . . . . . . . . . . . . . . . . . . . . . . . . . . . . . . . . . . . . . . . . . . . . . . . . . . $ 113,432 $ 125,702
Noncurrent regulatory assets . . . . . . . . . . . . . . . . . . . . . . . . . . . . . . . . . . . . . . . . . . . . . . . . . . . . . . . . 1,558,649 1,343,432
Deferred income taxes . . . . . . . . . . . . . . . . . . . . . . . . . . . . . . . . . . . . . . . . . . . . . . . . . . . . . . . . . . . . . 29,143 26,403
Net-of-tax accumulated OCI . . . . . . . . . . . . . . . . . . . . . . . . . . . . . . . . . . . . . . . . . . . . . . . . . . . . . . . . 45,833 41,313
Total. . . . . . . . . . . . . . . . . . . . . . . . . . . . . . . . . . . . . . . . . . . . . . . . . . . . . . . . . . . . . . . . . . . . . . . . . . $ 1,747,057 $ 1,536,850
Measurement date . . . . . . . . . . . . . . . . . . . . . . . . . . . . . . . . . . . . . . . . . . . . . . . . . . . . . . . . . . . . . . . . Dec. 31, 2014 Dec. 31, 2013


