Xcel Energy 2014 Annual Report Download - page 132
Download and view the complete annual report
Please find page 132 of the 2014 Xcel Energy annual report below. You can navigate through the pages in the report by either clicking on the pages listed below, or by using the keyword search tool below to find specific information within the annual report.-
 1
1 -
2
-
3
-
4
-
5
-
6
-
7
-
8
-
9
-
10
-
11
-
12
-
13
-
14
-
15
-
16
-
17
-
18
-
19
-
20
-
21
-
22
-
23
-
24
-
25
-
26
-
27
-
28
-
29
-
30
-
31
-
32
-
33
-
34
-
35
-
36
-
37
-
38
-
39
-
40
-
41
-
42
-
43
-
44
-
45
-
46
-
47
-
48
-
49
-
50
-
51
-
52
-
53
-
54
-
55
-
56
-
57
-
58
-
59
-
60
-
61
-
62
-
63
-
64
-
65
-
66
-
67
-
68
-
69
-
70
-
71
-
72
-
73
-
74
-
75
-
76
-
77
-
78
-
79
-
80
-
81
-
82
-
83
-
84
-
85
-
86
-
87
-
88
-
89
-
90
-
91
-
92
-
93
-
94
-
95
-
96
-
97
-
98
-
99
-
100
-
101
-
102
-
103
-
104
-
105
-
106
-
107
-
108
-
109
-
110
-
111
-
112
-
113
-
114
-
115
-
116
-
117
-
118
-
119
-
120
-
121
-
 122
122 -
 123
123 -
 124
124 -
 125
125 -
 126
126 -
 127
127 -
 128
128 -
 129
129 -
 130
130 -
 131
131 -
 132
132 -
 133
133 -
 134
134 -
 135
135 -
 136
136 -
 137
137 -
 138
138 -
 139
139 -
 140
140 -
 141
141 -
 142
142 -
143
-
144
-
145
-
146
-
147
-
148
-
149
-
150
-
151
-
152
-
153
-
154
-
155
-
156
-
157
-
158
-
159
-
160
-
161
-
162
-
163
-
164
-
165
-
166
-
167
-
168
-
169
-
170
-
171
-
172
-
173
-
174
-
175
-
176
-
177
-
178
-
179
-
180
-
181
-
182
-
183
-
184
 |
 |
114
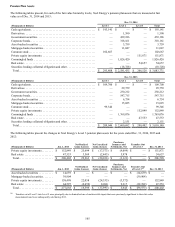
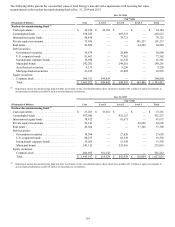
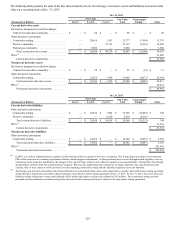
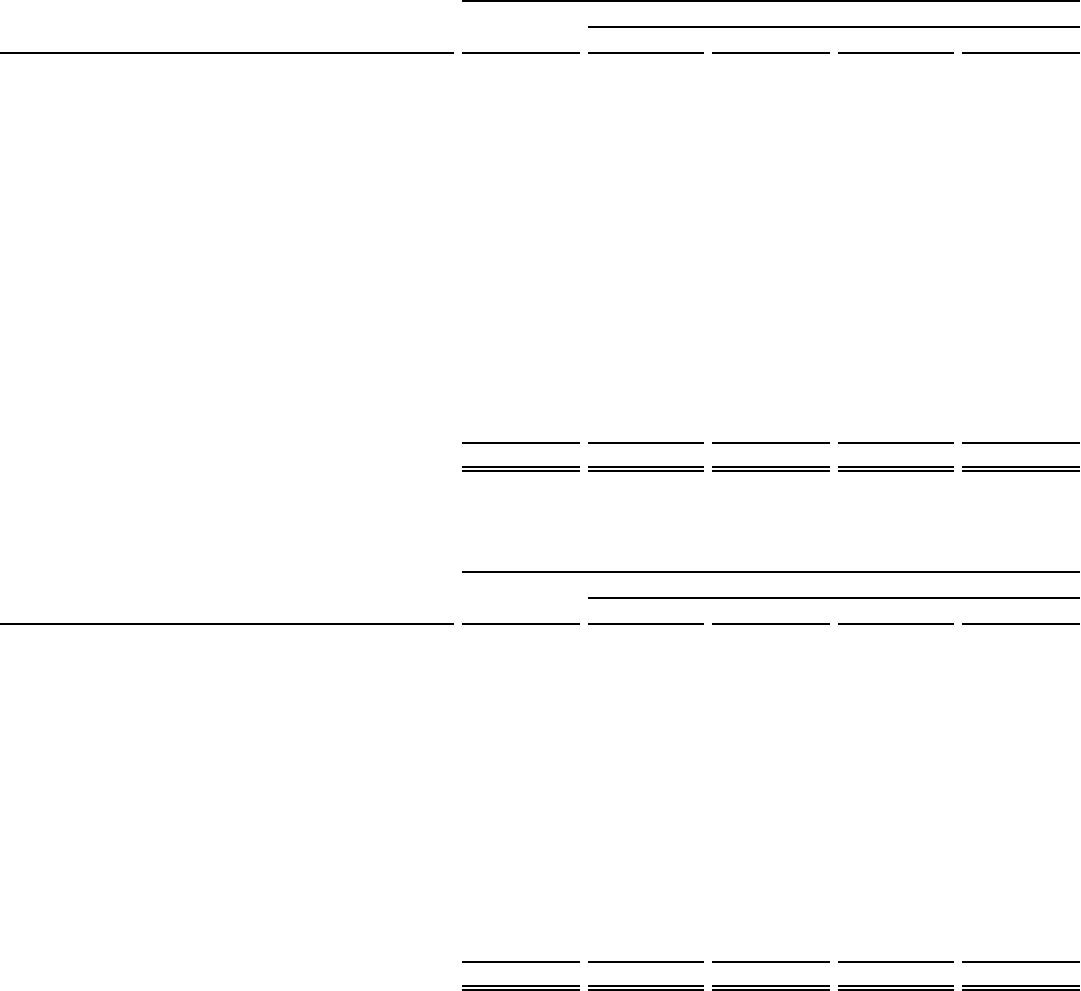
The following tables present the cost and fair value of Xcel Energy’s non-derivative instruments with recurring fair value
measurements in the nuclear decommissioning fund at Dec. 31, 2014 and 2013:
Dec. 31, 2014
Fair Value
(Thousands of Dollars) Cost Level 1 Level 2 Level 3 Total
Nuclear decommissioning fund (a)
Cash equivalents . . . . . . . . . . . . . . . . . . . . . . . . . . . . . $ 24,184 $ 24,184 $ — $ — $ 24,184
Commingled funds. . . . . . . . . . . . . . . . . . . . . . . . . . . . 470,013 — 465,615 — 465,615
International equity funds . . . . . . . . . . . . . . . . . . . . . . 80,454 — 78,721 — 78,721
Private equity investments. . . . . . . . . . . . . . . . . . . . . . 73,936 — — 101,237 101,237
Real estate . . . . . . . . . . . . . . . . . . . . . . . . . . . . . . . . . . 43,859 — — 64,249 64,249
Debt securities:
Government securities. . . . . . . . . . . . . . . . . . . . . . . 30,674 — 28,808 — 28,808
U.S. corporate bonds. . . . . . . . . . . . . . . . . . . . . . . . 81,463 — 77,562 — 77,562
International corporate bonds . . . . . . . . . . . . . . . . . 16,950 — 16,341 — 16,341
Municipal bonds . . . . . . . . . . . . . . . . . . . . . . . . . . . 242,282 — 249,201 — 249,201
Asset-backed securities. . . . . . . . . . . . . . . . . . . . . . 9,131 — 9,250 — 9,250
Mortgage-backed securities . . . . . . . . . . . . . . . . . . 23,225 — 23,895 — 23,895
Equity securities:
Common stock . . . . . . . . . . . . . . . . . . . . . . . . . . . . 369,751 564,858 — — 564,858
Total. . . . . . . . . . . . . . . . . . . . . . . . . . . . . . . . . . . . . $ 1,465,922 $ 589,042 $ 949,393 $ 165,486 $ 1,703,921
(a) Reported in nuclear decommissioning fund and other investments on the consolidated balance sheet, which also includes $83.1 million of equity investments in
unconsolidated subsidiaries and $45.6 million of miscellaneous investments.
Dec. 31, 2013
Fair Value
(Thousands of Dollars) Cost Level 1 Level 2 Level 3 Total
Nuclear decommissioning fund (a)
Cash equivalents . . . . . . . . . . . . . . . . . . . . . . . . . . . . . $ 33,281 $ 33,281 $ — $ — $ 33,281
Commingled funds. . . . . . . . . . . . . . . . . . . . . . . . . . . . 457,986 — 452,227 — 452,227
International equity funds . . . . . . . . . . . . . . . . . . . . . . 78,812 — 81,671 — 81,671
Private equity investments. . . . . . . . . . . . . . . . . . . . . . 52,143 — — 62,696 62,696
Real estate . . . . . . . . . . . . . . . . . . . . . . . . . . . . . . . . . . 45,564 — — 57,368 57,368
Debt securities:
Government securities. . . . . . . . . . . . . . . . . . . . . . . 34,304 — 27,628 — 27,628
U.S. corporate bonds. . . . . . . . . . . . . . . . . . . . . . . . 80,275 — 83,538 — 83,538
International corporate bonds . . . . . . . . . . . . . . . . . 15,025 — 15,358 — 15,358
Municipal bonds . . . . . . . . . . . . . . . . . . . . . . . . . . . 241,112 — 232,016 — 232,016
Equity securities:
Common stock . . . . . . . . . . . . . . . . . . . . . . . . . . . . 406,695 581,243 — — 581,243
Total. . . . . . . . . . . . . . . . . . . . . . . . . . . . . . . . . . . . . $ 1,445,197 $ 614,524 $ 892,438 $ 120,064 $ 1,627,026
(a) Reported in nuclear decommissioning fund and other investments on the consolidated balance sheet, which also includes $87.1 million of equity investments in
unconsolidated subsidiaries and $41.9 million of miscellaneous investments.