Xcel Energy 2014 Annual Report Download - page 120
Download and view the complete annual report
Please find page 120 of the 2014 Xcel Energy annual report below. You can navigate through the pages in the report by either clicking on the pages listed below, or by using the keyword search tool below to find specific information within the annual report.-
 1
1 -
2
-
3
-
4
-
5
-
6
-
7
-
8
-
9
-
10
-
11
-
12
-
13
-
14
-
15
-
16
-
17
-
18
-
19
-
20
-
21
-
22
-
23
-
24
-
25
-
26
-
27
-
28
-
29
-
30
-
31
-
32
-
33
-
34
-
35
-
36
-
37
-
38
-
39
-
40
-
41
-
42
-
43
-
44
-
45
-
46
-
47
-
48
-
49
-
50
-
51
-
52
-
53
-
54
-
55
-
56
-
57
-
58
-
59
-
60
-
61
-
62
-
63
-
64
-
65
-
66
-
67
-
68
-
69
-
70
-
71
-
72
-
73
-
74
-
75
-
76
-
77
-
78
-
79
-
80
-
81
-
82
-
83
-
84
-
85
-
86
-
87
-
88
-
89
-
90
-
91
-
92
-
93
-
94
-
95
-
96
-
97
-
98
-
99
-
100
-
101
-
102
-
103
-
104
-
105
-
106
-
107
-
108
-
109
-
 110
110 -
 111
111 -
 112
112 -
 113
113 -
 114
114 -
 115
115 -
 116
116 -
 117
117 -
 118
118 -
 119
119 -
 120
120 -
 121
121 -
 122
122 -
 123
123 -
 124
124 -
 125
125 -
 126
126 -
 127
127 -
 128
128 -
 129
129 -
 130
130 -
131
-
132
-
133
-
134
-
135
-
136
-
137
-
138
-
139
-
140
-
141
-
142
-
143
-
144
-
145
-
146
-
147
-
148
-
149
-
150
-
151
-
152
-
153
-
154
-
155
-
156
-
157
-
158
-
159
-
160
-
161
-
162
-
163
-
164
-
165
-
166
-
167
-
168
-
169
-
170
-
171
-
172
-
173
-
174
-
175
-
176
-
177
-
178
-
179
-
180
-
181
-
182
-
183
-
184
 |
 |

102
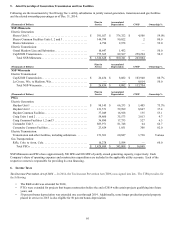
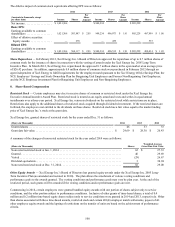
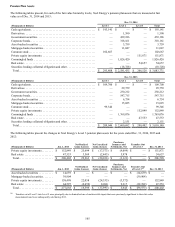
A summary of the stock equivalent unit changes for the year ended 2014 are as follows:
(Units in Thousands) Units Weighted Average
Grant Date Fair Value
Stock equivalent units at Jan. 1, 2014 . . . . . . . . . . . . . . . . . . . . . . . . . . . . . . . . . . . . . . . . . . . . . . . 636 $ 22.98
Granted . . . . . . . . . . . . . . . . . . . . . . . . . . . . . . . . . . . . . . . . . . . . . . . . . . . . . . . . . . . . . . . . . . . . . . 62 30.57
Units distributed . . . . . . . . . . . . . . . . . . . . . . . . . . . . . . . . . . . . . . . . . . . . . . . . . . . . . . . . . . . . . . . (33) 21.09
Dividend equivalents. . . . . . . . . . . . . . . . . . . . . . . . . . . . . . . . . . . . . . . . . . . . . . . . . . . . . . . . . . . . 25 30.80
Stock equivalent units at Dec. 31, 2014 . . . . . . . . . . . . . . . . . . . . . . . . . . . . . . . . . . . . . . . . . . . . . 690 24.03
TSR Liability Awards — Xcel Energy Inc.’s Board of Directors has granted TSR liability awards under the Xcel Energy Inc. 2005
Long-Term Incentive Plan (as amended and restated effective in 2010). The plan allows Xcel Energy to attach various performance
goals to the awards granted. The liability awards granted have been historically dependent on a single measure of performance, Xcel
Energy Inc.’s relative TSR measured over a three-year period. For 2014 and 2013 awards, Xcel Energy Inc.’s TSR is compared to the
TSR of other companies in a 23-member utilities peer group. For 2012 awards, TSR is compared to the EEI Investor-Owned Electrics
Index. At the end of the three-year period, potential payouts of the awards range from zero to 200 percent, depending on Xcel Energy
Inc.’s TSR compared to the applicable peer group or index.
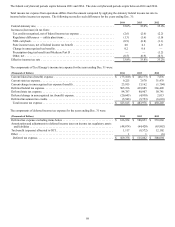
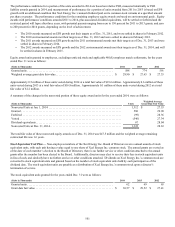
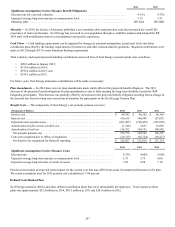
The TSR liability awards granted for the years ended Dec. 31 were as follows:
(In Thousands) 2014 2013 2012
Awards granted . . . . . . . . . . . . . . . . . . . . . . . . . . . . . . . . . . . . . . . . . . . . . . . . . . . . . . . . . . 270 215 161
The total amounts of TSR liability awards settled during the years ended Dec. 31 were as follows:
(In Thousands) 2014 2013 2012
Awards settled . . . . . . . . . . . . . . . . . . . . . . . . . . . . . . . . . . . . . . . . . . . . . . . . . . . . . . . . . . . — 108 286
Settlement amount (cash and common stock). . . . . . . . . . . . . . . . . . . . . . . . . . . . . . . . . . . $ — $ 3,057 $ 7,554
The amount of cash used to settle Xcel Energy’s TSR liability awards was $1.5 million and $3.8 million in 2013 and 2012,
respectively.
Share-Based Compensation Expense — Other than for restricted stock and certain 401(k) employer match settlements, the vesting of
employee equity awards is generally predicated on the achievement of a performance condition, which is the achievement of a TSR,
EPS or environmental measures target. Additionally, approximately 0.4 million and 0.2 million of equity awards were granted in 2014
and 2013, respectively, with vesting subject only to service conditions for periods up to five years. All of these instruments are
considered to be equity awards, generally since the plan settlement determination (shares or cash) resides with Xcel Energy and not
the participants. In addition, these awards have not been previously settled in cash and Xcel Energy plans to continue electing share
settlement. The grant date fair value of equity awards is expensed over the service period as employees vest in their rights to those
awards.
The TSR liability awards have been historically settled partially in cash, and therefore do not qualify as equity awards, but rather are
accounted for as liabilities. As liability awards, the fair value on which ratable expense is based, as employees vest in their rights to
those awards, is remeasured each period based on the current stock price and performance achievement, and final expense is based on
the market value of the shares on the date the award is settled.
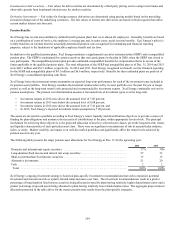
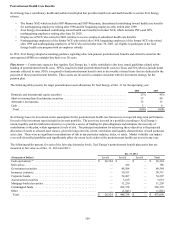
The compensation costs related to share-based awards for the years ended Dec. 31 were as follows:
(Thousands of Dollars) 2014 2013 2012
Compensation cost for share-based awards (a) (b) (c) . . . . . . . . . . . . . . . . . . . . . . . . . . . . . . . $ 32,189 $ 24,613 $ 26,970
Tax benefit recognized in income . . . . . . . . . . . . . . . . . . . . . . . . . . . . . . . . . . . . . . . . . . . . 12,557 9,571 10,513
Capitalized compensation cost for share-based awards . . . . . . . . . . . . . . . . . . . . . . . . . . . 1,887 1,698 4,270
(a) Compensation costs for share-based payment arrangements are included in O&M expense in the consolidated statements of income.
(b) Included in compensation cost for share-based awards are matching contributions related to the Xcel Energy 401(k) plan, which totaled $7.4 million, $7.0 million,
and $22.2 million for the years ended 2014, 2013 and 2012, respectively.
(c) In October 2013, Xcel Energy determined that it would settle the 401(k) employer match in cash instead of common stock going forward for all employee groups
except PSCo bargaining employees. Share-based compensation accounting for the impacted employee groups ceased in October 2013, and corresponding expense
amounts recorded to equity were reclassified to a liability for expected cash settlements.