Xcel Energy 2014 Annual Report Download - page 87
Download and view the complete annual report
Please find page 87 of the 2014 Xcel Energy annual report below. You can navigate through the pages in the report by either clicking on the pages listed below, or by using the keyword search tool below to find specific information within the annual report.-
 1
1 -
2
-
3
-
4
-
5
-
6
-
7
-
8
-
9
-
10
-
11
-
12
-
13
-
14
-
15
-
16
-
17
-
18
-
19
-
20
-
21
-
22
-
23
-
24
-
25
-
26
-
27
-
28
-
29
-
30
-
31
-
32
-
33
-
34
-
35
-
36
-
37
-
38
-
39
-
40
-
41
-
42
-
43
-
44
-
45
-
46
-
47
-
48
-
49
-
50
-
51
-
52
-
53
-
54
-
55
-
56
-
57
-
58
-
59
-
60
-
61
-
62
-
63
-
64
-
65
-
66
-
67
-
68
-
69
-
70
-
71
-
72
-
73
-
74
-
75
-
76
-
 77
77 -
 78
78 -
 79
79 -
 80
80 -
 81
81 -
 82
82 -
 83
83 -
 84
84 -
 85
85 -
 86
86 -
 87
87 -
 88
88 -
 89
89 -
 90
90 -
 91
91 -
 92
92 -
 93
93 -
 94
94 -
 95
95 -
 96
96 -
 97
97 -
98
-
99
-
100
-
101
-
102
-
103
-
104
-
105
-
106
-
107
-
108
-
109
-
110
-
111
-
112
-
113
-
114
-
115
-
116
-
117
-
118
-
119
-
120
-
121
-
122
-
123
-
124
-
125
-
126
-
127
-
128
-
129
-
130
-
131
-
132
-
133
-
134
-
135
-
136
-
137
-
138
-
139
-
140
-
141
-
142
-
143
-
144
-
145
-
146
-
147
-
148
-
149
-
150
-
151
-
152
-
153
-
154
-
155
-
156
-
157
-
158
-
159
-
160
-
161
-
162
-
163
-
164
-
165
-
166
-
167
-
168
-
169
-
170
-
171
-
172
-
173
-
174
-
175
-
176
-
177
-
178
-
179
-
180
-
181
-
182
-
183
-
184
 |
 |

69
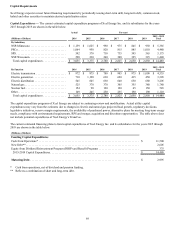
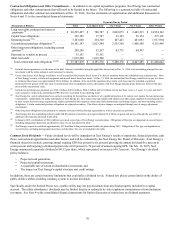
Capital Requirements
Xcel Energy expects to meet future financing requirements by periodically issuing short-term debt, long-term debt, common stock,
hybrid and other securities to maintain desired capitalization ratios.
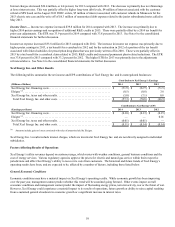
Capital Expenditures — The current estimated capital expenditure programs of Xcel Energy Inc. and its subsidiaries for the years
2015 through 2019 are shown in the table below.
Actual Forecast
(Millions of Dollars) 2014 2015 2016 2017 2018 2019 2015 - 2019
Total
By Subsidiary
NSP-Minnesota . . . . . . . . . . . . . . . . . . . . . . . . . $ 1,159 $ 1,625 $ 990 $ 975 $ 845 $ 950 $ 5,385
PSCo. . . . . . . . . . . . . . . . . . . . . . . . . . . . . . . . . . 1,064 950 820 815 885 1,010 4,480
SPS . . . . . . . . . . . . . . . . . . . . . . . . . . . . . . . . . . . 542 570 710 735 595 565 3,175
NSP-Wisconsin. . . . . . . . . . . . . . . . . . . . . . . . . . 290 230 260 300 325 325 1,440
Total capital expenditures . . . . . . . . . . . . . . . . $ 3,055 $ 3,375 $ 2,780 $ 2,825 $ 2,650 $ 2,850 $ 14,480
By Function 2014 2015 2016 2017 2018 2019 2015 - 2019
Total
Electric transmission . . . . . . . . . . . . . . . . . . . . . $ 972 $ 875 $ 780 $ 905 $ 975 $ 1,000 $ 4,535
Electric generation . . . . . . . . . . . . . . . . . . . . . . . 710 1,190 630 620 415 450 3,305
Electric distribution . . . . . . . . . . . . . . . . . . . . . . 545 605 630 640 650 680 3,205
Natural gas . . . . . . . . . . . . . . . . . . . . . . . . . . . . . 525 370 370 305 355 380 1,780
Nuclear fuel . . . . . . . . . . . . . . . . . . . . . . . . . . . . 154 90 120 120 65 150 545
Other. . . . . . . . . . . . . . . . . . . . . . . . . . . . . . . . . . 149 245 250 235 190 190 1,110
Total capital expenditures . . . . . . . . . . . . . . . . $ 3,055 $ 3,375 $ 2,780 $ 2,825 $ 2,650 $ 2,850 $ 14,480
The capital expenditure programs of Xcel Energy are subject to continuing review and modification. Actual utility capital
expenditures may vary from the estimates due to changes in electric and natural gas projected load growth, regulatory decisions,
legislative initiatives, reserve margin requirements, the availability of purchased power, alternative plans for meeting long-term energy
needs, compliance with environmental requirements, RPS and merger, acquisition and divestiture opportunities. The table above does
not include potential expenditures of Xcel Energy’s TransCos.
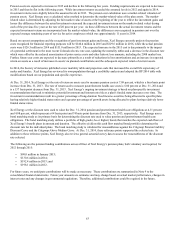
The current estimated financing plans to fund capital expenditures of Xcel Energy Inc. and its subsidiaries for the years 2015 through
2019 are shown in the table below.
(Millions of Dollars)
Funding Capital Expenditures
Cash from Operations* . . . . . . . . . . . . . . . . . . . . . . . . . . . . . . . . . . . . . . . . . . . . . . . . . . . . . . . . . . . . . . . . . . . . . . $ 11,500
New Debt** . . . . . . . . . . . . . . . . . . . . . . . . . . . . . . . . . . . . . . . . . . . . . . . . . . . . . . . . . . . . . . . . . . . . . . . . . . . . . . . 2,605
Equity from Dividend Reinvestment Program (DRIP) and Benefit Programs . . . . . . . . . . . . . . . . . . . . . . . . . . . . 375
2015-2019 Capital Expenditures. . . . . . . . . . . . . . . . . . . . . . . . . . . . . . . . . . . . . . . . . . . . . . . . . . . . . . . . . . . . . . $ 14,480
Maturing Debt . . . . . . . . . . . . . . . . . . . . . . . . . . . . . . . . . . . . . . . . . . . . . . . . . . . . . . . . . . . . . . . . . . . . . . . . . . . . $ 2,995
* Cash from operations, net of dividend and pension funding.
** Reflects a combination of short and long-term debt.