Xcel Energy 2014 Annual Report Download - page 133
Download and view the complete annual report
Please find page 133 of the 2014 Xcel Energy annual report below. You can navigate through the pages in the report by either clicking on the pages listed below, or by using the keyword search tool below to find specific information within the annual report.-
 1
1 -
2
-
3
-
4
-
5
-
6
-
7
-
8
-
9
-
10
-
11
-
12
-
13
-
14
-
15
-
16
-
17
-
18
-
19
-
20
-
21
-
22
-
23
-
24
-
25
-
26
-
27
-
28
-
29
-
30
-
31
-
32
-
33
-
34
-
35
-
36
-
37
-
38
-
39
-
40
-
41
-
42
-
43
-
44
-
45
-
46
-
47
-
48
-
49
-
50
-
51
-
52
-
53
-
54
-
55
-
56
-
57
-
58
-
59
-
60
-
61
-
62
-
63
-
64
-
65
-
66
-
67
-
68
-
69
-
70
-
71
-
72
-
73
-
74
-
75
-
76
-
77
-
78
-
79
-
80
-
81
-
82
-
83
-
84
-
85
-
86
-
87
-
88
-
89
-
90
-
91
-
92
-
93
-
94
-
95
-
96
-
97
-
98
-
99
-
100
-
101
-
102
-
103
-
104
-
105
-
106
-
107
-
108
-
109
-
110
-
111
-
112
-
113
-
114
-
115
-
116
-
117
-
118
-
119
-
120
-
121
-
122
-
 123
123 -
 124
124 -
 125
125 -
 126
126 -
 127
127 -
 128
128 -
 129
129 -
 130
130 -
 131
131 -
 132
132 -
 133
133 -
 134
134 -
 135
135 -
 136
136 -
 137
137 -
 138
138 -
 139
139 -
 140
140 -
 141
141 -
 142
142 -
 143
143 -
144
-
145
-
146
-
147
-
148
-
149
-
150
-
151
-
152
-
153
-
154
-
155
-
156
-
157
-
158
-
159
-
160
-
161
-
162
-
163
-
164
-
165
-
166
-
167
-
168
-
169
-
170
-
171
-
172
-
173
-
174
-
175
-
176
-
177
-
178
-
179
-
180
-
181
-
182
-
183
-
184
 |
 |

115
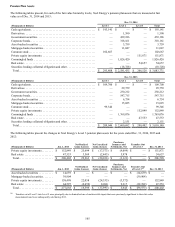
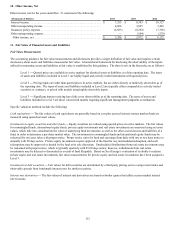
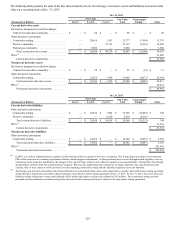
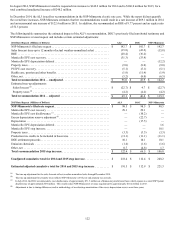
The following tables present the changes in Level 3 nuclear decommissioning fund investments:
(Thousands of Dollars) Jan. 1, 2014 Purchases Settlements
Gains
Recognized as
Regulatory
Assets (a) Transfers Out
of Level 3 Dec. 31, 2014
Private equity investments . . . . . . . $ 62,696 $ 22,078 $ (286) $ 16,749 $ — $ 101,237
Real estate . . . . . . . . . . . . . . . . . . . 57,368 8,088 (9,794) 8,587 — 64,249
Total. . . . . . . . . . . . . . . . . . . . . . . $ 120,064 $ 30,166 $ (10,080) $ 25,336 $ — $ 165,486
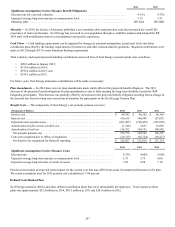
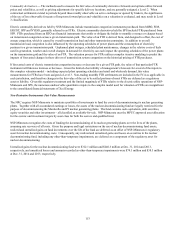
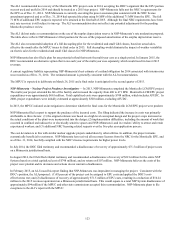
(Thousands of Dollars) Jan. 1, 2013 Purchases Settlements
Gains
Recognized as
Regulatory
Assets (a) Transfers Out
of Level 3 (b) Dec. 31, 2013
Private equity investments . . . . . . . $ 33,250 $ 24,201 $ — $ 5,245 $ — $ 62,696
Real estate . . . . . . . . . . . . . . . . . . . 39,074 31,626 (18,622) 5,290 — 57,368
Asset-backed securities . . . . . . . . . 2,067 — — — (2,067) —
Mortgage-backed securities . . . . . . 30,209 — — — (30,209) —
Total. . . . . . . . . . . . . . . . . . . . . . . $ 104,600 $ 55,827 $ (18,622) $ 10,535 $ (32,276) $ 120,064
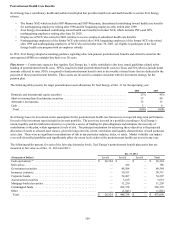
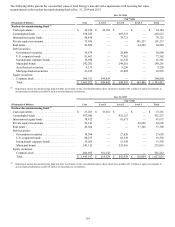
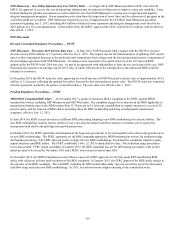
(Thousands of Dollars) Jan. 1, 2012 Purchases Settlements
Gains (Losses)
Recognized as
Regulatory
Assets (a) Transfers Out
of Level 3 Dec. 31, 2012
Private equity investments . . . . . . . $ 9,203 $ 20,671 $ (1,931) $ 5,307 $ — $ 33,250
Real estate . . . . . . . . . . . . . . . . . . . 26,395 9,777 (3,611) 6,513 — 39,074
Asset-backed securities . . . . . . . . . 16,501 — (14,450) 16 — 2,067
Mortgage-backed securities . . . . . . 78,664 33,016 (79,899)(1,572) — 30,209
Total. . . . . . . . . . . . . . . . . . . . . . . $ 130,763 $ 63,464 $ (99,891) $ 10,264 $ — $ 104,600
(a) Gains and losses are deferred as a component of the regulatory asset for nuclear decommissioning.
(b) Transfers out of Level 3 into Level 2 were principally due to diminished use of unobservable inputs that were previously significant to these fair value
measurements and were subsequently sold during 2013.
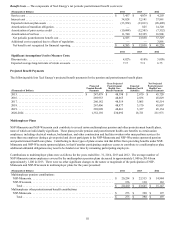
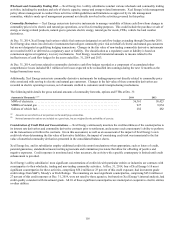
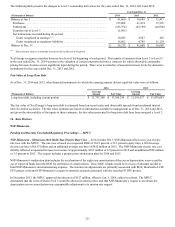
The following table summarizes the final contractual maturity dates of the debt securities in the nuclear decommissioning fund, by
asset class, at Dec. 31, 2014:
Final Contractual Maturity
(Thousands of Dollars) Due in 1 Year
or Less Due in 1 to 5
Years Due in 5 to 10
Years Due after 10
Years Total
Government securities. . . . . . . . . . . . . . . $ — $ — $ — $ 28,808 $ 28,808
U.S. corporate bonds . . . . . . . . . . . . . . . . 300 15,530 62,838 (1,106) 77,562
International corporate bonds . . . . . . . . . — 4,212 12,129 — 16,341
Municipal bonds . . . . . . . . . . . . . . . . . . . 1,893 35,048 41,530 170,730 249,201
Asset-backed securities . . . . . . . . . . . . . . — — 6,389 2,861 9,250
Mortgage-backed securities. . . . . . . . . . . — — — 23,895 23,895
Debt securities. . . . . . . . . . . . . . . . . . . . $ 2,193 $ 54,790 $ 122,886 $ 225,188 $ 405,057
Derivative Instruments Fair Value Measurements
Xcel Energy enters into derivative instruments, including forward contracts, futures, swaps and options, for trading purposes and to
manage risk in connection with changes in interest rates, utility commodity prices and vehicle fuel prices.
Interest Rate Derivatives — Xcel Energy enters into various instruments that effectively fix the interest payments on certain floating
rate debt obligations or effectively fix the yield or price on a specified benchmark interest rate for an anticipated debt issuance for a
specific period. These derivative instruments are generally designated as cash flow hedges for accounting purposes.
At Dec. 31, 2014, accumulated other comprehensive losses related to interest rate derivatives included $2.8 million of net losses
expected to be reclassified into earnings during the next 12 months as the related hedged interest rate transactions impact earnings,
including forecasted amounts for unsettled hedges, as applicable.