Xcel Energy 2014 Annual Report Download - page 119
Download and view the complete annual report
Please find page 119 of the 2014 Xcel Energy annual report below. You can navigate through the pages in the report by either clicking on the pages listed below, or by using the keyword search tool below to find specific information within the annual report.-
 1
1 -
2
-
3
-
4
-
5
-
6
-
7
-
8
-
9
-
10
-
11
-
12
-
13
-
14
-
15
-
16
-
17
-
18
-
19
-
20
-
21
-
22
-
23
-
24
-
25
-
26
-
27
-
28
-
29
-
30
-
31
-
32
-
33
-
34
-
35
-
36
-
37
-
38
-
39
-
40
-
41
-
42
-
43
-
44
-
45
-
46
-
47
-
48
-
49
-
50
-
51
-
52
-
53
-
54
-
55
-
56
-
57
-
58
-
59
-
60
-
61
-
62
-
63
-
64
-
65
-
66
-
67
-
68
-
69
-
70
-
71
-
72
-
73
-
74
-
75
-
76
-
77
-
78
-
79
-
80
-
81
-
82
-
83
-
84
-
85
-
86
-
87
-
88
-
89
-
90
-
91
-
92
-
93
-
94
-
95
-
96
-
97
-
98
-
99
-
100
-
101
-
102
-
103
-
104
-
105
-
106
-
107
-
108
-
 109
109 -
 110
110 -
 111
111 -
 112
112 -
 113
113 -
 114
114 -
 115
115 -
 116
116 -
 117
117 -
 118
118 -
 119
119 -
 120
120 -
 121
121 -
 122
122 -
 123
123 -
 124
124 -
 125
125 -
 126
126 -
 127
127 -
 128
128 -
 129
129 -
130
-
131
-
132
-
133
-
134
-
135
-
136
-
137
-
138
-
139
-
140
-
141
-
142
-
143
-
144
-
145
-
146
-
147
-
148
-
149
-
150
-
151
-
152
-
153
-
154
-
155
-
156
-
157
-
158
-
159
-
160
-
161
-
162
-
163
-
164
-
165
-
166
-
167
-
168
-
169
-
170
-
171
-
172
-
173
-
174
-
175
-
176
-
177
-
178
-
179
-
180
-
181
-
182
-
183
-
184
 |
 |

101
The performance conditions for a portion of the units awarded in 2014 are based on relative TSR, measured identically to TSR
liability awards granted in 2014, and measurement of performance for a portion of units awarded from 2011 to 2013 is based on EPS
growth with an additional condition that Xcel Energy Inc.’s annual dividend paid on its common stock remains at a specified amount
per share or greater. The performance conditions for the remaining employee equity awards are based on environmental goals. Equity
awards with performance conditions awarded 2011 to 2014, plus associated dividend equivalents, will be settled or forfeited and the
restricted period will lapse after three years, with potential payouts ranging from zero to 150 percent for 2011 to 2013 grants, and zero
to 200 percent for 2014 grants, depending on the level of achievement.
• The 2010 awards measured on EPS growth met their targets as of Dec. 31, 2011, and were settled in shares in February 2012.
• The 2010 environmental awards met their targets as of Dec. 31, 2012 and were settled in shares in February 2013.
• The 2011 awards measured on EPS growth and the 2011 environmental awards met their targets as of Dec. 31, 2013 and were
settled in shares in February 2014.
• The 2012 awards measured on EPS growth and the 2012 environmental awards met their targets as of Dec. 31, 2014, and will
be settled in shares in February 2015.
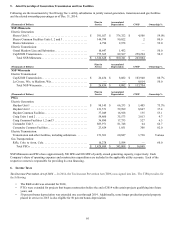
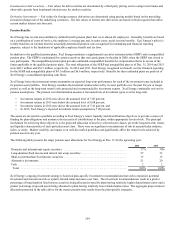
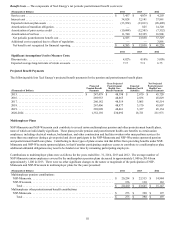
Equity award units granted to employees, excluding restricted stock and applicable 401(k) employer match settlements, for the years
ended Dec. 31 were as follows:
(Units in Thousands) 2014 2013 2012
Granted units . . . . . . . . . . . . . . . . . . . . . . . . . . . . . . . . . . . . . . . . . . . . . . . . . . . . . . . . . . . . 588 774 591
Weighted average grant date fair value. . . . . . . . . . . . . . . . . . . . . . . . . . . . . . . . . . . . . . . . $ 29.90 $ 27.65 $ 27.35
Approximately 0.5 million of these units vested during 2014 at a total fair value of $19.6 million. Approximately 0.6 million of these
units vested during 2013 at a total fair value of $16.8 million. Approximately 0.1 million of these units vested during 2012 at a total
fair value of $1.2 million.
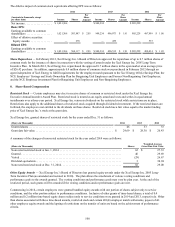
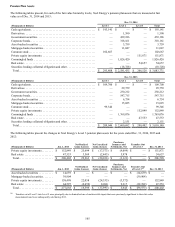
A summary of the changes in the nonvested portion of these equity award units for the year ended 2014, were as follows:
(Units in Thousands) Units Weighted Average
Grant Date Fair Value
Nonvested Units at Jan. 1, 2014 . . . . . . . . . . . . . . . . . . . . . . . . . . . . . . . . . . . . . . . . . . . . . . . . . . . 1,312 $ 27.53
Granted . . . . . . . . . . . . . . . . . . . . . . . . . . . . . . . . . . . . . . . . . . . . . . . . . . . . . . . . . . . . . . . . . . . . . . 588 29.90
Forfeited . . . . . . . . . . . . . . . . . . . . . . . . . . . . . . . . . . . . . . . . . . . . . . . . . . . . . . . . . . . . . . . . . . . . . (99) 28.36
Vested . . . . . . . . . . . . . . . . . . . . . . . . . . . . . . . . . . . . . . . . . . . . . . . . . . . . . . . . . . . . . . . . . . . . . . . (546) 27.34
Dividend equivalents. . . . . . . . . . . . . . . . . . . . . . . . . . . . . . . . . . . . . . . . . . . . . . . . . . . . . . . . . . . . 67 28.04
Nonvested Units at Dec. 31, 2014. . . . . . . . . . . . . . . . . . . . . . . . . . . . . . . . . . . . . . . . . . . . . . . . . . 1,322 28.63
The total fair value of these nonvested equity awards as of Dec. 31, 2014 was $47.5 million and the weighted average remaining
contractual life was 1.6 years.
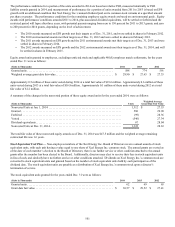
Stock Equivalent Unit Plan — Non-employee members of the Xcel Energy Inc. Board of Directors receive annual awards of stock
equivalent units, with each unit having a value equal to one share of Xcel Energy Inc. common stock. The annual grants are vested as
of the date of each member’s election to the Board of Directors; there is no further service or other condition attached to the annual
grants after the member has been elected to the Board. Additionally, directors may elect to receive their fees in stock equivalent units
in lieu of cash, and similarly have no further service or other conditions attached. Dividends on Xcel Energy Inc.’s common stock are
converted to stock equivalent units and granted based on the number of stock equivalent units held by each participant as of the
dividend date. The stock equivalent units are payable as a distribution of Xcel Energy Inc.’s common stock upon a director’s
termination of service.
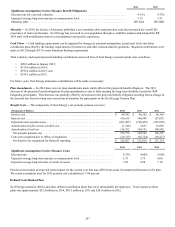
The stock equivalent units granted for the years ended Dec. 31 were as follows:
(Units in Thousands) 2014 2013 2012
Granted units . . . . . . . . . . . . . . . . . . . . . . . . . . . . . . . . . . . . . . . . . . . . . . . . . . . . . . . . . . . . 62 69 65
Grant date fair value . . . . . . . . . . . . . . . . . . . . . . . . . . . . . . . . . . . . . . . . . . . . . . . . . . . . . . $ 30.57 $ 29.52 $ 27.41