Xcel Energy 2014 Annual Report Download - page 129
Download and view the complete annual report
Please find page 129 of the 2014 Xcel Energy annual report below. You can navigate through the pages in the report by either clicking on the pages listed below, or by using the keyword search tool below to find specific information within the annual report.-
 1
1 -
2
-
3
-
4
-
5
-
6
-
7
-
8
-
9
-
10
-
11
-
12
-
13
-
14
-
15
-
16
-
17
-
18
-
19
-
20
-
21
-
22
-
23
-
24
-
25
-
26
-
27
-
28
-
29
-
30
-
31
-
32
-
33
-
34
-
35
-
36
-
37
-
38
-
39
-
40
-
41
-
42
-
43
-
44
-
45
-
46
-
47
-
48
-
49
-
50
-
51
-
52
-
53
-
54
-
55
-
56
-
57
-
58
-
59
-
60
-
61
-
62
-
63
-
64
-
65
-
66
-
67
-
68
-
69
-
70
-
71
-
72
-
73
-
74
-
75
-
76
-
77
-
78
-
79
-
80
-
81
-
82
-
83
-
84
-
85
-
86
-
87
-
88
-
89
-
90
-
91
-
92
-
93
-
94
-
95
-
96
-
97
-
98
-
99
-
100
-
101
-
102
-
103
-
104
-
105
-
106
-
107
-
108
-
109
-
110
-
111
-
112
-
113
-
114
-
115
-
116
-
117
-
118
-
 119
119 -
 120
120 -
 121
121 -
 122
122 -
 123
123 -
 124
124 -
 125
125 -
 126
126 -
 127
127 -
 128
128 -
 129
129 -
 130
130 -
 131
131 -
 132
132 -
 133
133 -
 134
134 -
 135
135 -
 136
136 -
 137
137 -
 138
138 -
 139
139 -
140
-
141
-
142
-
143
-
144
-
145
-
146
-
147
-
148
-
149
-
150
-
151
-
152
-
153
-
154
-
155
-
156
-
157
-
158
-
159
-
160
-
161
-
162
-
163
-
164
-
165
-
166
-
167
-
168
-
169
-
170
-
171
-
172
-
173
-
174
-
175
-
176
-
177
-
178
-
179
-
180
-
181
-
182
-
183
-
184
 |
 |

111
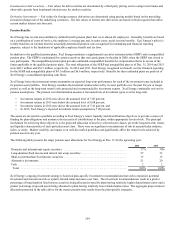
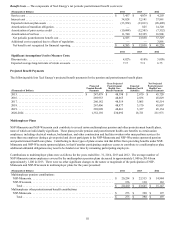
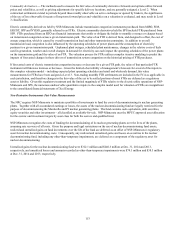
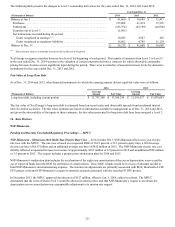
Benefit Costs — The components of Xcel Energy’s net periodic postretirement benefit costs were:
(Thousands of Dollars) 2014 2013 2012
Service cost . . . . . . . . . . . . . . . . . . . . . . . . . . . . . . . . . . . . . . . . . . . . . . . . . . . . . . . . . . . . . $ 3,457 $ 4,079 $ 4,203
Interest cost . . . . . . . . . . . . . . . . . . . . . . . . . . . . . . . . . . . . . . . . . . . . . . . . . . . . . . . . . . . . . 34,028 32,141 37,861
Expected return on plan assets . . . . . . . . . . . . . . . . . . . . . . . . . . . . . . . . . . . . . . . . . . . . . . (33,954)(33,011) (28,409)
Amortization of transition obligation . . . . . . . . . . . . . . . . . . . . . . . . . . . . . . . . . . . . . . . . . — 825 14,320
Amortization of prior service credit . . . . . . . . . . . . . . . . . . . . . . . . . . . . . . . . . . . . . . . . . . (10,688)(12,501) (7,552)
Amortization of net loss . . . . . . . . . . . . . . . . . . . . . . . . . . . . . . . . . . . . . . . . . . . . . . . . . . . 11,740 22,325 16,906
Net periodic postretirement benefit cost. . . . . . . . . . . . . . . . . . . . . . . . . . . . . . . . . . . . . . 4,583 13,858 37,329
Additional cost recognized due to effects of regulation . . . . . . . . . . . . . . . . . . . . . . . . . . . — — 3,891
Net benefit cost recognized for financial reporting. . . . . . . . . . . . . . . . . . . . . . . . . . . . . . $ 4,583 $ 13,858 $ 41,220
2014 2013 2012
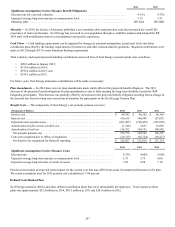
Significant Assumptions Used to Measure Costs:
Discount rate . . . . . . . . . . . . . . . . . . . . . . . . . . . . . . . . . . . . . . . . . . . . . . . . . . . . . . . . . . . . 4.82% 4.10% 5.00%
Expected average long-term rate of return on assets. . . . . . . . . . . . . . . . . . . . . . . . . . . . . . 7.17 7.11 6.75
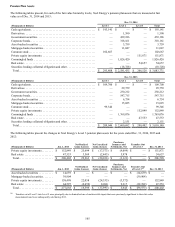
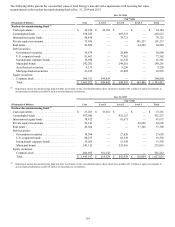
Projected Benefit Payments
The following table lists Xcel Energy’s projected benefit payments for the pension and postretirement benefit plans:
(Thousands of Dollars)
Projected
Pension Benefit
Payments
Gross Projected
Postretirement
Health Care
Benefit Payments
Expected
Medicare Part D
Subsidies
Net Projected
Postretirement
Health Care
Benefit Payments
2015 . . . . . . . . . . . . . . . . . . . . . . . . . . . . . . . . . . . . . . . . . . . . . . $ 247,479 $ 48,398 $ 2,670 $ 45,728
2016 . . . . . . . . . . . . . . . . . . . . . . . . . . . . . . . . . . . . . . . . . . . . . . 269,953 48,665 2,836 45,829
2017 . . . . . . . . . . . . . . . . . . . . . . . . . . . . . . . . . . . . . . . . . . . . . . 260,182 48,519 3,005 45,514
2018 . . . . . . . . . . . . . . . . . . . . . . . . . . . . . . . . . . . . . . . . . . . . . . 267,406 48,977 3,170 45,807
2019 . . . . . . . . . . . . . . . . . . . . . . . . . . . . . . . . . . . . . . . . . . . . . . 269,809 48,461 3,327 45,134
2020-2024 . . . . . . . . . . . . . . . . . . . . . . . . . . . . . . . . . . . . . . . . . 1,352,192 230,692 18,721 211,971
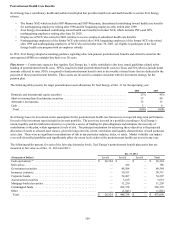
Multiemployer Plans
NSP-Minnesota and NSP-Wisconsin each contribute to several union multiemployer pension and other postretirement benefit plans,
none of which are individually significant. These plans provide pension and postretirement health care benefits to certain union
employees, including electrical workers, boilermakers, and other construction and facilities workers who may perform services for
more than one employer during a given period and do not participate in the NSP-Minnesota and NSP-Wisconsin sponsored pension
and postretirement health care plans. Contributing to these types of plans creates risk that differs from providing benefits under NSP-
Minnesota and NSP-Wisconsin sponsored plans, in that if another participating employer ceases to contribute to a multiemployer plan,
additional unfunded obligations may need to be funded over time by remaining participating employers.
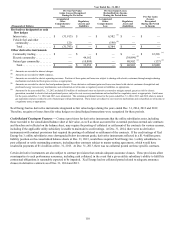
Contributions to multiemployer plans were as follows for the years ended Dec. 31, 2014, 2013 and 2012. The average number of
NSP-Minnesota union employees covered by the multiemployer pension plans decreased to approximately 1,000 in 2014 from
approximately 1,100 in 2013. There were no other significant changes to the nature or magnitude of the participation of NSP-
Minnesota and NSP-Wisconsin in multiemployer plans for the years presented:
(Thousands of Dollars) 2014 2013 2012
Multiemployer pension contributions:
NSP-Minnesota. . . . . . . . . . . . . . . . . . . . . . . . . . . . . . . . . . . . . . . . . . . . . . . . . . . . . . . . . $ 20,254 $ 23,515 $ 14,984
NSP-Wisconsin. . . . . . . . . . . . . . . . . . . . . . . . . . . . . . . . . . . . . . . . . . . . . . . . . . . . . . . . . 156 130 163
Total . . . . . . . . . . . . . . . . . . . . . . . . . . . . . . . . . . . . . . . . . . . . . . . . . . . . . . . . . . . . . . . $ 20,410 $ 23,645 $ 15,147
Multiemployer other postretirement benefit contributions:
NSP-Minnesota. . . . . . . . . . . . . . . . . . . . . . . . . . . . . . . . . . . . . . . . . . . . . . . . . . . . . . . . . $ 273 $ 390 $ 197
Total . . . . . . . . . . . . . . . . . . . . . . . . . . . . . . . . . . . . . . . . . . . . . . . . . . . . . . . . . . . . . . . $ 273 $ 390 $ 197