Xcel Energy 2014 Annual Report Download - page 39
Download and view the complete annual report
Please find page 39 of the 2014 Xcel Energy annual report below. You can navigate through the pages in the report by either clicking on the pages listed below, or by using the keyword search tool below to find specific information within the annual report.-
 1
1 -
2
-
3
-
4
-
5
-
6
-
7
-
8
-
9
-
10
-
11
-
12
-
13
-
14
-
15
-
16
-
17
-
18
-
19
-
20
-
21
-
22
-
23
-
24
-
25
-
26
-
27
-
28
-
 29
29 -
 30
30 -
 31
31 -
 32
32 -
 33
33 -
 34
34 -
 35
35 -
 36
36 -
 37
37 -
 38
38 -
 39
39 -
 40
40 -
 41
41 -
 42
42 -
 43
43 -
 44
44 -
 45
45 -
 46
46 -
 47
47 -
 48
48 -
 49
49 -
50
-
51
-
52
-
53
-
54
-
55
-
56
-
57
-
58
-
59
-
60
-
61
-
62
-
63
-
64
-
65
-
66
-
67
-
68
-
69
-
70
-
71
-
72
-
73
-
74
-
75
-
76
-
77
-
78
-
79
-
80
-
81
-
82
-
83
-
84
-
85
-
86
-
87
-
88
-
89
-
90
-
91
-
92
-
93
-
94
-
95
-
96
-
97
-
98
-
99
-
100
-
101
-
102
-
103
-
104
-
105
-
106
-
107
-
108
-
109
-
110
-
111
-
112
-
113
-
114
-
115
-
116
-
117
-
118
-
119
-
120
-
121
-
122
-
123
-
124
-
125
-
126
-
127
-
128
-
129
-
130
-
131
-
132
-
133
-
134
-
135
-
136
-
137
-
138
-
139
-
140
-
141
-
142
-
143
-
144
-
145
-
146
-
147
-
148
-
149
-
150
-
151
-
152
-
153
-
154
-
155
-
156
-
157
-
158
-
159
-
160
-
161
-
162
-
163
-
164
-
165
-
166
-
167
-
168
-
169
-
170
-
171
-
172
-
173
-
174
-
175
-
176
-
177
-
178
-
179
-
180
-
181
-
182
-
183
-
184
 |
 |

21
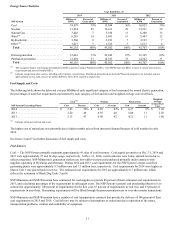
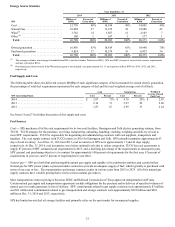
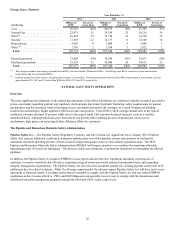
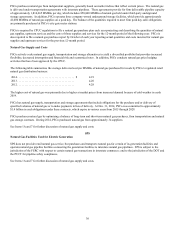
Energy Source Statistics
Year Ended Dec. 31
2014 2013 2012
SPS Millions of
KWh Percent of
Generation Millions of
KWh Percent of
Generation Millions of
KWh Percent of
Generation
Coal. . . . . . . . . . . . . . . . . . . . . . . . . . . . . . . . 12,770 48% 14,184 49% 14,005 49%
Natural Gas . . . . . . . . . . . . . . . . . . . . . . . . . . 10,068 37 11,235 38 12,088 43
Wind (a) . . . . . . . . . . . . . . . . . . . . . . . . . . . . . 3,762 14 3,507 12 2,103 7
Other (b) . . . . . . . . . . . . . . . . . . . . . . . . . . . . . 180 1 167 1 177 1
Total . . . . . . . . . . . . . . . . . . . . . . . . . . . . . . 26,780 100% 29,093 100% 28,373 100%
Owned generation . . . . . . . . . . . . . . . . . . . . . 16,956 63% 18,814 65% 19,940 70%
Purchased generation . . . . . . . . . . . . . . . . . . 9,824 37 10,279 35 8,433 30
Total . . . . . . . . . . . . . . . . . . . . . . . . . . . . . . 26,780 100% 29,093 100% 28,373 100%
(a) This category includes wind energy de-bundled from RECs and also includes Windsource RECs. SPS uses RECs to meet or exceed state resource requirements
and may sell surplus RECs.
(b) Distributed generation from the Solar*Rewards program is not included, was approximately 10, 11, and eight net million KWh for 2014, 2013, and 2012,
respectively.
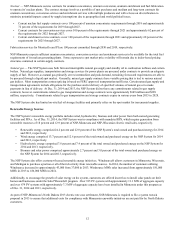
Fuel Supply and Costs
The following table shows the delivered cost per MMBtu of each significant category of fuel consumed for owned electric generation,
the percentage of total fuel requirements represented by each category of fuel and the total weighted average cost of all fuels.
Coal Natural Gas Weighted
Average Owned
Fuel Cost
SPS Generating Plants Cost Percent Cost Percent
2014 . . . . . . . . . . . . . . . . . . . . . . . . . . . . . . . . . . . . . . . . . . . . . . $ 2.07 71% $ 4.76 29% $ 2.85
2013 . . . . . . . . . . . . . . . . . . . . . . . . . . . . . . . . . . . . . . . . . . . . . . 2.14 71 3.97 29 2.68
2012 . . . . . . . . . . . . . . . . . . . . . . . . . . . . . . . . . . . . . . . . . . . . . . 1.87 67 2.99 33 2.24
See Items 1A and 7 for further discussion of fuel supply and costs.
Fuel Sources
Coal — SPS purchases all of the coal requirements for its two coal facilities, Harrington and Tolk electric generating stations, from
TUCO. TUCO arranges for the purchase, receiving, transporting, unloading, handling, crushing, weighing and delivery of coal to
meet SPS’ requirements. TUCO is responsible for negotiating and administering contracts with coal suppliers, transporters and
handlers. The coal supply contract with TUCO expires in 2016 for Harrington and Tolk. SPS normally maintains approximately 43
days of coal inventory. As of Dec. 31, 2014 and 2013, coal inventories at SPS were approximately 17 and 42 days supply,
respectively. At Dec. 31, 2014, coal inventories were below optimal levels due to railcar congestion. TUCO has coal agreements to
supply 87 percent of SPS’ estimated coal requirements in 2015, and a declining percentage of the requirements in subsequent years.
SPS’ general coal purchasing objective is to contract for approximately 100 percent of requirements for the first year, 67 percent of
requirements in year two, and 33 percent of requirements in year three.
Natural gas — SPS uses both firm and interruptible natural gas supply and standby oil in combustion turbines and certain boilers.
Natural gas for SPS’ power plants is procured under contracts to provide an adequate supply of fuel; which typically is purchased with
terms of one year or less. The transportation and storage contracts expire in various years from 2015 to 2033. All of the natural gas
supply contracts have variable pricing that is tied to various natural gas indices.
Most transportation contract pricing is based on FERC and Railroad Commission of Texas approved transportation tariff rates.
Certain natural gas supply and transportation agreements include obligations for the purchase and/or delivery of specified volumes of
natural gas or to make payments in lieu of delivery. SPS’ commitments related to gas supply contracts were approximately $3 million
and $21 million and commitments related to gas transportation and storage contracts were approximately $222 million and $201
million at Dec. 31, 2014 and 2013, respectively.
SPS has limited on-site fuel oil storage facilities and primarily relies on the spot market for incremental supplies.