Xcel Energy 2014 Annual Report Download - page 2
Download and view the complete annual report
Please find page 2 of the 2014 Xcel Energy annual report below. You can navigate through the pages in the report by either clicking on the pages listed below, or by using the keyword search tool below to find specific information within the annual report.-
 1
1 -
 2
2 -
 3
3 -
 4
4 -
 5
5 -
 6
6 -
 7
7 -
 8
8 -
 9
9 -
 10
10 -
 11
11 -
 12
12 -
 13
13 -
 14
14 -
 15
15 -
 16
16 -
 17
17 -
 18
18 -
 19
19 -
 20
20 -
 21
21 -
 22
22 -
 23
23 -
 24
24 -
 25
25 -
 26
26 -
 27
27 -
 28
28 -
 29
29 -
 30
30 -
 31
31 -
 32
32 -
 33
33 -
 34
34 -
 35
35 -
 36
36 -
 37
37 -
 38
38 -
 39
39 -
 40
40 -
 41
41 -
 42
42 -
 43
43 -
 44
44 -
 45
45 -
 46
46 -
 47
47 -
 48
48 -
 49
49 -
 50
50 -
 51
51 -
 52
52 -
 53
53 -
 54
54 -
 55
55 -
 56
56 -
 57
57 -
 58
58 -
 59
59 -
 60
60 -
 61
61 -
 62
62 -
 63
63 -
 64
64 -
 65
65 -
 66
66 -
 67
67 -
 68
68 -
 69
69 -
 70
70 -
 71
71 -
 72
72 -
 73
73 -
 74
74 -
 75
75 -
 76
76 -
 77
77 -
 78
78 -
 79
79 -
 80
80 -
 81
81 -
 82
82 -
 83
83 -
 84
84 -
 85
85 -
 86
86 -
 87
87 -
 88
88 -
 89
89 -
 90
90 -
 91
91 -
 92
92 -
 93
93 -
 94
94 -
 95
95 -
 96
96 -
 97
97 -
 98
98 -
 99
99 -
 100
100 -
 101
101 -
 102
102 -
 103
103 -
 104
104 -
 105
105 -
 106
106 -
 107
107 -
 108
108 -
 109
109 -
 110
110 -
 111
111 -
 112
112 -
 113
113 -
 114
114 -
 115
115 -
 116
116 -
 117
117 -
 118
118 -
 119
119 -
 120
120 -
 121
121 -
 122
122 -
 123
123 -
 124
124 -
 125
125 -
 126
126 -
 127
127 -
 128
128 -
 129
129 -
 130
130 -
 131
131 -
 132
132 -
 133
133 -
 134
134 -
 135
135 -
 136
136 -
 137
137 -
 138
138 -
 139
139 -
 140
140 -
 141
141 -
 142
142 -
 143
143 -
 144
144 -
 145
145 -
 146
146 -
 147
147 -
 148
148 -
 149
149 -
 150
150 -
 151
151 -
 152
152 -
 153
153 -
 154
154 -
 155
155 -
 156
156 -
 157
157 -
 158
158 -
 159
159 -
 160
160 -
 161
161 -
 162
162 -
 163
163 -
 164
164 -
 165
165 -
 166
166 -
 167
167 -
 168
168 -
 169
169 -
 170
170 -
 171
171 -
 172
172 -
 173
173 -
 174
174 -
 175
175 -
 176
176 -
 177
177 -
 178
178 -
 179
179 -
 180
180 -
 181
181 -
 182
182 -
 183
183 -
 184
184
 |
 |

On the Cover:
Construction crews are on the job at
Xcel Energy’s Cherokee Generating
Station, where the company is making
changes to deliver cleaner, more
reliable energy for customers.
Company Description
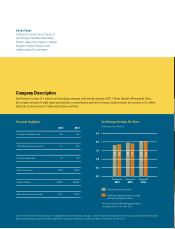
Xcel Energy is a major U.S. electric and natural gas company, with annual revenues of $11.7 billion. Based in Minneapolis, Minn.,
the company operates in eight states and provides a comprehensive portfolio of energy-related products and services to 3.5 million
electricity customers and 2.0 million natural gas customers.
2012
2.0
1.5
1.0
0.5
0.0
2.5
2013
2013
Ongoing earnings per share*
GAAP (generally accepted accounting
principles) earnings per share
Some of the sections in this annual report, including the letter to shareholders on page 1, contain forward-looking statements. For a discussion of factors that could
affect operating results, please see the management’s discussion and analysis listed in the table of contents of the Form 10-K.
* A reconciliation to GAAP earnings per share is
located in Item 7 of the Form 10-K.
2014
2014
Xcel Energy Earnings Per Share
Dollars per share (diluted)
Financial Highlights
1.82
1.95
2.03
1.85
1.91
2.03
Ongoing earnings per share 1.95 2.03
Total GAAP earnings per share 1.91 2.03
Dividends annualized 1.12 1.20
Stock price (close) 27.94 35.92
Assets (millions) 33,907 36,958
Book value per common share 19.21 20.20
